Sushi Roll: A CPU research kernel with minimal noise for cycle-by-cycle micro-architectural introspection
Follow me at @gamozolabs on Twitter if you want notifications when new blogs come up. I also do random one-off posts for cool data that doesn’t warrant an entire blog!
Summary
In this blog we’re going to go into details about a CPU research kernel I’ve developed: Sushi Roll. This kernel uses multiple creative techniques to measure undefined behavior on Intel micro-architectures. Sushi Roll is designed to have minimal noise such that tiny micro-architectural events can be measured, such as speculative execution and cache-coherency behavior. With creative use of performance counters we’re able to accurately plot micro-architectural activity on a graph with an x-axis in cycles.
We’ll go a lot more into detail about what everything in this graph means later in the blog, but here’s a simple example of just some of the data we can collect:
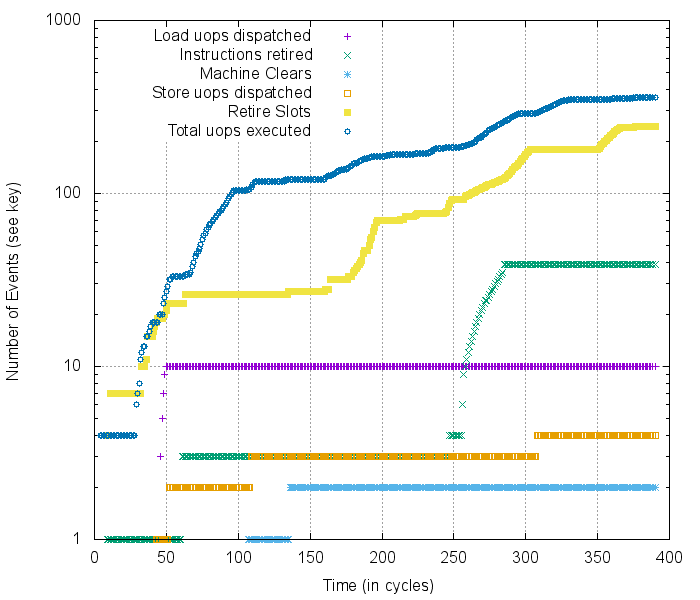 Example cycle-by-cycle profiling of the Kaby Lake micro-architecture, warning: log-scale y-axis
Agenda
This is a relatively long blog and will be split into 4 major sections.
- The gears that turn in your CPU: A high-level explanation of modern Intel micro-architectures
- Sushi Roll: The design of the low-noise research kernel
- Cycle-by-cycle micro-architectural introspection: A unique usage of performance counters to observe cycle-by-cycle micro-architectural behaviors
- Results: Putting the pieces together and making graphs of cool micro-architectural behavior
Why?
In the past year I’ve spent a decent amount of time doing CPU vulnerability research. I’ve written proof-of-concept exploits for nearly every CPU vulnerability, from many attacker perspectives (user leaking kernel, user/kernel leaking hypervisor, guest leaking other guest, etc). These exploits allowed us to provide developers and researchers with real-world attacks to verify mitigations.
CPU research happens to be an overlap of my two primary research interests: vulnerability research and high-performance kernel development. I joined Microsoft in the early winter of 2017 and this lined up pretty closely with the public release of the Meltdown and Spectre CPU attacks. As I didn’t yet have much on my plate, the idea was floated that I could look into some of the CPU vulnerabilities. I got pretty lucky with this timing, as I ended up really enjoying the work and ended up sinking most of my free time into it.
My workflow for research often starts with writing some custom tools for measuring and analysis of a given target. Whether the target is a web browser, PDF parser, remote attack surface, or a CPU, I’ve often found that the best thing you can do is just make something new. Try out some new attack surface, write a targeted fuzzer for a specific feature, etc. Doing something new doesn’t have to be better or more difficult than something that was done before, as often there are completely unexplored surfaces out there. My specialty is introspection. I find unique ways to measure behaviors, which then fuels the idea pool for code auditing or fuzzer development.
This leads to an interesting situation in CPU research… it’s largely blind. Lots of the current CPU research is done based on writing snippets of code and reviewing the overall side-effects of it (via cache timing, performance counters, etc). These overall side-effects may also include noise from other processor activity, from the OS task switching processes, other cores changing the MESI-state of cache lines, etc. I happened to already have a low-noise no-shared-memory research kernel that I developed for vectorized emulation on Xeon Phis! This lead to a really good starting point for throwing in some performance counters and measuring CPU behaviors… and the results were a bit better than expected.
TL;DR: I enjoy writing tools to measure things, so I wrote a tool to measure undefined CPU behavior.
The gears that turn in your CPU
Feel free to skip this section entirely if you’re familiar with modern processor architecture
Your modern Intel CPU is a fairly complex beast when you care about every technical detail, but lets look at it from a higher level. Here’s what the micro-architecture (uArch) looks like in a modern Intel Skylake processor.
 Skylake uArch diagram, Diagram from WikiChip
There are 3 main components: The front end, which converts complex x86 instructions into groups of micro-operations. The execution engine, which executes the micro-operations. And the memory subsystem, which makes sure that the processor is able to get streams of instructions and data.
Front End
The front end covers almost everything related to figuring out which micro-operations (uops) need to be dispatched to the execution engine in order to accomplish a task. The execution engine on a modern Intel processor does not directly execute x86 instructions, rather these instructions are converted to these micro-operations which are fixed in size and specific to the processor micro-architecture.
Instruction fetch and cache
There’s a lot that happens prior to the actual execution of an instruction. First, the memory containing the instruction is read into the L1 instruction cache, ideally brought in from the L2 cache as to minimize delay. At this point the instruction is still a macro-op (a variable-length x86 instruction), which is quite a pain to work with. The processor still doesn’t know how large the instruction is, so during pre-decode the processor will do an initial length decode to determine the instruction boundaries.
At this point the instruction has been chopped up and is ready for the instruction queue!
Instruction Queue and Macro Fusion
Instructions that come in for execution might be quite simple, and could potentially be “fused” into a complex operation. This stage is not publicly documented, but we know that a very common fusion is combining compare instructions with conditional branches. This allows a common instruction pattern like:
cmp rax, 5
jne .offset
To be combined into a single macro-op with the same semantics. This complex fused operation now only takes up one slot in many parts of the CPU pipeline, rather than two, freeing up more resources to other operations.
Decode
Instruction decode is where the x86 macro-ops get converted into micro-ops. These micro-ops vary heavily by uArch, and allow Intel to regularly change fundamentals in their processors without affecting backwards compatibility with the x86 architecture. There’s a lot of magic that happens in the decoder, but mostly what matters is that the variable-length macro-ops get converted into the fixed-length micro-ops. There are multiple ways that this conversion happens. Instructions might directly convert to uops, and this is the common path for most x86 instructions. However, some instructions, or even processor conditions, may cause something called microcode to get executed.
Microcode
Some instructions in x86 trigger microcode to be used. Microcode is effectively a tiny collection of uops which will be executed on certain conditions. Think of this like a C/C++ macro, where you can have a one-liner for something that expands to much more. When an operation does something that requires microcode, the microcode ROM is accessed and the uops it specifies are placed into the pipeline. These are often complex operations, like switching operating modes, reading/writing internal CPU registers, etc. This microcode ROM also gives Intel an opportunity to make changes to instruction behaviors entirely with a microcode patch.
uop Cache
There’s also a uop cache which allows previously decoded instructions to skip the entire pre-decode and decode process. Like standard memory caching, this provides a huge speedup and dramatically reduces bottlenecks in the front-end.
Allocation Queue
The allocation queue is responsible for holding a bunch of uops which need to be executed. These are then fed to the execution engine when the execution engine has resources available to execute them.
Execution engine
The execution engine does exactly what you would expect: it executes things. But at this stage your processor starts moving your instructions around to speed things up.
 Things start to get a bit complex at this point, click for details!
Renaming / Allocating / Retirement
Resources need to be allocated for certain operations. There are a lot more registers in the processor than the standard x86 registers. These registers are allocated out for temporary operations, and often mapped onto their corresponding x86 registers.
There are a lot of optimizations the CPU can do at this stage. It can eliminate register moves by aliasing registers (such that two x86 registers “point to” the same internal register). It can remove known zeroing instructions (like xor with self, or and with zero) from the pipeline, and just zero the registers directly. These optimizations are frequently improved each generation.
Finally, when instructions have completed successfully, they are retired. This retirement commits the internal micro-architectural state back out to the x86 architectural state. It’s also when memory operations become visible to other CPUs.
Re-ordering
uOP re-ordering is important to modern CPU performance. Future instructions which do not depend on the current instruction, could execute while waiting for the results of the current one.
For example:
mov rax, [rax]
add rbx, rcx
In this short example we see that we perform a 64-bit load from the address in rax and store it back into rax. Memory operations can be quite expensive, ranging from 4 cycles for a L1 cache hit, to 250 cycles and beyond for an off-processor memory access.
The processor is able to realize that the add rbx, rcx instruction does not need to “wait” for the result of the load, and can send off the add uop for execution while waiting for the load to complete.
This is where things can start to get weird. The processor starts to perform operations in a different order than what you told it to. The processor then holds the results and makes sure they “appear” to other cores in the correct order, as x86 is a strongly-ordered architecture. Other architectures like ARM are typically weakly-ordered, and it’s up to the developer to insert fences in the instruction stream to tell the processor the specific order operations need to complete in. This ordering is not an issue on a single core, but it may affect the way another core observes the memory transactions you perform.
For example:
Core 0 executes the following:
mov [shared_memory.pointer], rax ; Store the pointer in `rax` to shared memory
mov [shared_memory.owned],   0   ; Mark that we no longer own the shared memory
Core 1 executes the following:
.try_again:
    cmp [shared_memory.owned], 0 ; Check if someone owns this memory
    jne .try_again               ; Someone owns this memory, wait a bit longer

    mov rax, [shared_memory.pointer] ; Get the pointer
    mov rax, [rax]                   ; Read from the pointer
On x86 this is safe, as all aligned loads and stores are atomic, and are commit in a way that they appear in-order to all other processors. On something like ARM the owned value could be written to prior to pointer being written, allowing core 1 to use a stale/invalid pointer.
Execution Units
Finally we got to an easy part: the execution units. This is the silicon that is responsible for actually performing maths, loads, and stores. The core has multiple copies of this hardware logic for some of the common operations, which allows the same operation to be performed in parallel on separate data. For example, an add can be performed on 4 different execution units.
For things like loads, there are 2 load ports (port 2 and port 3), this allows 2 independent loads to be executed per cycle. Stores on the other hand, only have one port (port 4), and thus the core can only perform one store per cycle.
Memory subsystem
The memory subsystem on Intel is pretty complex, but we’re only going to go into the basics.
Caches
Caches are critical to modern CPU performance. RAM latency is so high (150-250 cycles) that a CPU is largely unusable without a cache. For example, if a modern x86 processor at 2.2 GHz had all caches disabled, it would never be able to execute more than ~15 million instructions per second. That’s as slow as an Intel 80486 from 1991.
When working on my first hypervisor I actually disabled all caching by mistake, and Windows took multiple hours to boot. It’s pretty incredible how important caches are.
For x86 there are typically 3 levels of cache: A level 1 cache, which is extremely fast, but small: 4 cycles latency. Followed by a level 2 cache, which is much larger, but still quite small: 14 cycles latency. Finally there’s the last-level-cache (LLC, typically the L3 cache), this is quite large, but has a higher latency: ~60 cycles.
The L1 and L2 caches are present in each core, however, the L3 cache is shared between multiple cores.
Translation Lookaside Buffers (TLBs)
In modern CPUs, applications almost never interface with physical memory directly. Rather they go through address translation to convert virtual addresses to physical addresses. This allows contiguous virtual memory regions to map to fragmented physical memory. Performing this translation requires 4 memory accesses (on 64-bit 4-level paging), and is quite expensive. Thus the CPU caches recently translated addresses such that it can skip this translation process during memory operations.
It is up to the OS to tell the CPU when to flush these TLBs via an invalidate page, invlpg instruction. If the OS doesn’t correctly invlpg memory when mappings change, it’s possible to use stale translation information.
Line fill buffers
While a load is pending, and not yet present in L1 cache, the data lives in a line fill buffer. The line fill buffers live between L2 cache and your L1 cache. When a memory access misses L1 cache, a line fill buffer entry is allocated, and once the load completes, the LFB is copied into the L1 cache and the LFB entry is discarded.
Store buffer
Store buffers are similar to line fill buffers. While waiting for resources to be available for a store to complete, it is placed into a store buffer. This allows for up to 56 stores (on Skylake) to be queued up, even if all other aspects of the memory subsystem are currently busy, or stores are not ready to be retired.
Further, loads which access memory will query the store buffers to potentially bypass the cache. If a read occurs on a recently stored location, the read could directly be filled from the store buffers. This is called store forwarding.
Load buffers
Similar to store buffers, load buffers are used for pending load uops. This sits between your execution units and L1 cache. This can hold up to 72 entries on Skylake.
CPU architecture summary and more info
That was a pretty high level introduction to many of the aspects of modern Intel CPU architecture. Every component of this diagram could have an entire blog written on it. Intel Manuals, WikiChip, Agner Fog’s CPU documentation, and many more, provide a more thorough documentation of Intel micro-architecture.
Sushi Roll
Sushi Roll is one of my favorite kernels! It wasn’t originally designed for CPU introspection, but it had some neat features which made it much more suitable for CPU research than my other kernels. We’ll talk a bit about why this kernel exists, and then talk about why it quickly became my go-to kernel for CPU research.
 Kernel mascot: Squishble Sushi Roll
A primer on Knights Landing
Sushi Roll was originally designed for my Vectorized Emulation work. Vectorized emulation was designed for the Intel Xeon Phi (Knights Landing), which is a pretty strange architecture. Even though it’s fully-featured traditional x86, standard software will “just work” on it, it is quite slow per individual thread. First of all, the clock rates are ~1.3 GHz, so there alone it’s about 2-3x slower than a “standard” x86 processor. Even further, it has fewer CPU resources for re-ordering and instruction decode. All-in-all the CPU is about 10x slower when running a single-threaded application compared to a “standard” 3 GHz modern Intel CPU. There’s also no L3 cache, so memory accesses can become much more expensive.
On top of these simple performance issues, there are more complex issues due to 4-way hyperthreading. Knights Landing was designed to be 4-way hyperthreaded (4 threads per core) to alleviate some of the performance losses of the limited instruction decode and caching. This allows threads to “block” on memory accesses while other threads with pending computations use the execution units. This 4-way hyperthreading, combined with 64-core processors, leads to 256 hardware threads showing up to your OS as cores.
Migrating processes and resources between these threads can be catastrophically slow. Standard shared-memory models also start to fall apart at this level of scaling (without specialized tuning). For example: If all 256 threads are hammering the same memory by performing an atomic increment (lock inc instruction), each individual increment will start to cost over 10,000 cycles! This is enough time for a single core on the Xeon Phi to do 640,000 single-precision floating point operations… just from a single increment! While most software treats atomics as “free locks”, they start to cause some serious cache-coherency pollution when scaled out this wide.
Obviously with some careful development you can mitigate these issues by decreasing the frequency of shared memory accesses. But perhaps we can develop a kernel that fundamentally disallows this behavior, preventing a developer from ever starting to go down the wrong path!
The original intent of Sushi Roll
Sushi Roll was designed from the start to be a massively parallel message-passing based kernel. The most notable feature of Sushi Roll is that there is no mutable shared memory allowed (a tiny exception made for the core IPC mechanism). This means that if you ever want to share information with another processor, you must pass that information via IPC. Shared immutable memory however, is allowed, as this doesn’t cause cache coherency traffic.
This design also meant that a lock never needed to be held, even atomic-level locks using the lock prefix. Rather than using locks, a specific core would own a hardware resource. For example, core #0 may own the network card, or a specific queue on the network card. Instead of requesting exclusive access to the NIC by obtaining a lock, you would send a message to core #0, indicating that you want to send a packet. All of the processing of these packets is done by the sender, thus the data is already formatted in a way that can be directly dropped into the NIC ring buffers. This made the owner of a hardware resource simply a mediator, reducing the latency to that resource.
While this makes the internals of the kernel a bit more complex, the programming model that a developer sees is still a standard send()/recv() model. By forcing message-passing, this ensured that all software written for this kernel could be scaled between multiple machines with no modification. On a single computer there is a fast, low-latency IPC mechanism that leverages some of the abilities to share memory (by transferring ownership of physical memory to the receiver). If the target for a message resided on another computer on the network, then the message would be serialized in a way that could be sent over the network. This complexity is yet again hidden from the developer, which allows for one program to be made that is scaled out without any extra effort.
No interrupts, no timers, no software threads, no processes
Sushi Roll follows a similar model to most of my other kernels. It has no interrupts, no timers, no software threads, and no processes. These are typically required for traditional operating systems, as to provide a user experience with multiple processes and users. However, my kernels are always designed for one purpose. This means the kernel boots up, and just does a given task on all cores (sometimes with one or two cores having a “special” responsibility).
By removing all of these external events, the CPU behaves a lot more deterministically. Sushi Roll goes the extra mile here, as it further reduces CPU noise by not having cores sharing memory and causing unexpected cache evictions or coherency traffic.
Soft Reboots
Similar to kexec on Linux, my kernels always support soft rebooting. This allows the old kernel (even a double faulted/corrupted kernel) to be replaced by a new kernel. This process takes about 200-300ms to tear down the old kernel, download the new one over PXE, and run the new one. This makes it feasible to have such a specialized kernel without processes, since I can just change the code of the kernel and boot up the new one in under a second. Rapid prototyping is crucial to fast development, and without this feature this kernel would be unusable.
Sushi Roll conclusion
Sushi Roll ended up being the perfect kernel for CPU introspection. It’s the lowest noise kernel I’ve ever developed, and it happened to also be my flagship kernel right as Spectre and Meltdown came out. By not having processes, threads, or interrupts, the CPU behaves much more deterministically than in a traditional OS.
Performance Counters
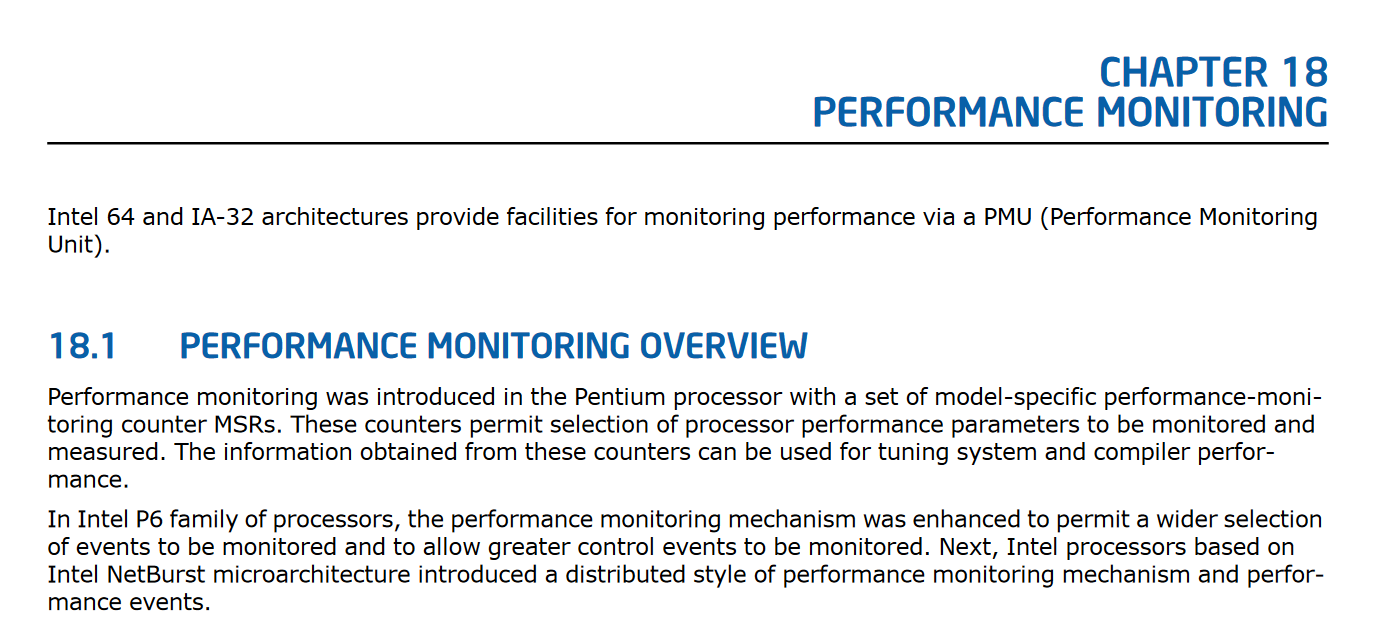
Before we get into how we got cycle-by-cycle micro-architectural data, we must learn a little bit about the performance monitoring available on Intel CPUs! This information can be explored in depth in the Intel System Developer Manual Volume 3b (note that the combined volume 3 manual doesn’t go into as much detail as the specific sub-volume manual).
Intel CPUs have a performance monitoring subsystem relying largely on a set of model-specific-registers (MSRs). These MSRs can be configured to track certain architectural events, typically by counting them. These counters are formally “performance monitoring counters”, often referred to as “performance counters” or PMCs.
These PMCs vary by micro-architecture. However, over time Intel has committed to offering a small subset of counters between multiple micro-architectures. These are called architectural performance counters. The version of these architectural performance counters are found in CPUID.0AH:EAX[7:0]. As of this writing there are 4 versions of architectural performance monitoring. The latest version provides a decent amount of generic information useful to general-purpose optimization. However, for a specific micro-architecture, the possibilities of performance events to track are almost limitless.
Basic usage of performance counters
To use the performance counters on Intel there are a few steps involved. First you must find a performance event you want to monitor. This information is found in per-micro-architecture tables found in the Intel Manual Volume 3b “Performance-Monitoring Events” chapter.
For example, here’s a very small selection of Skylake-specific performance events:
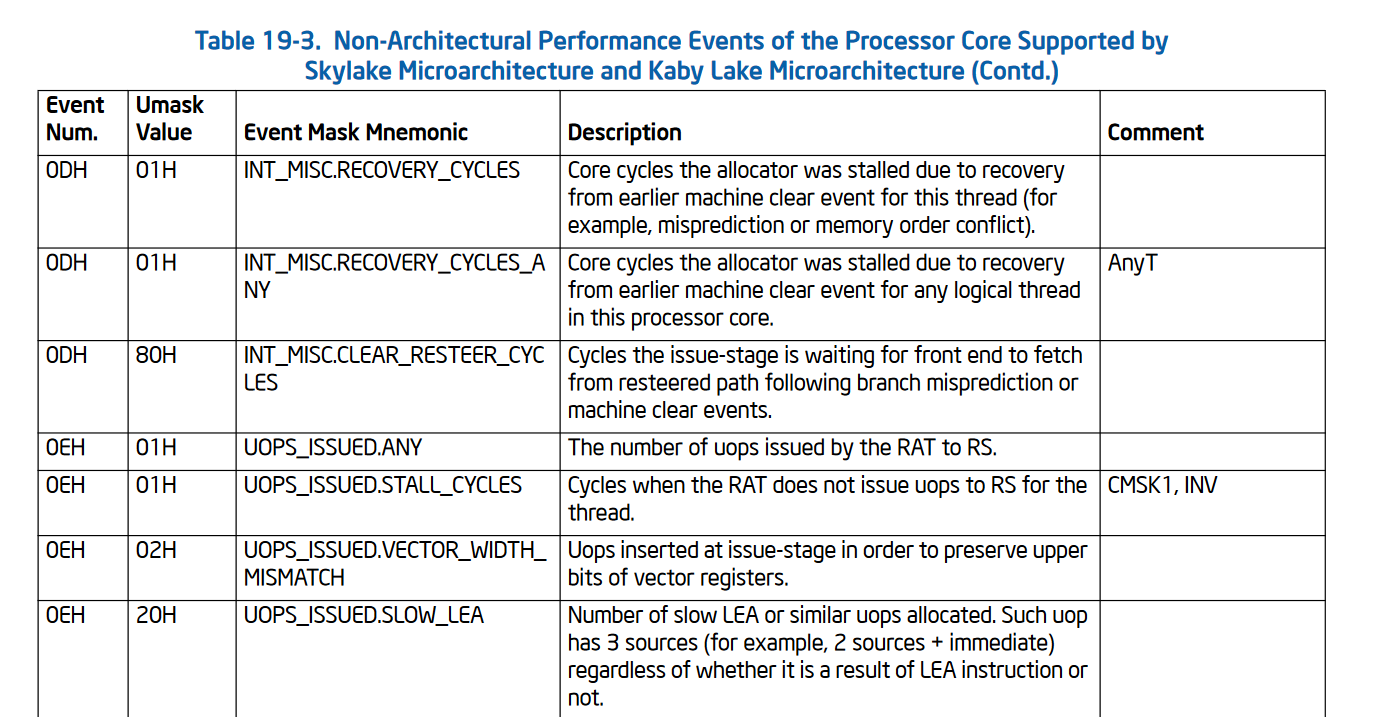
Intel performance counters largely rely on two banks of MSRs. The performance event selection MSRs, where the different events are programmed using the umask and event numbers from the table above. And the performance counter MSRs which hold the counts themselves.
The performance event selection MSRs (IA32_PERFEVTSELx) start at address 0x186 and span a contiguous MSR region. The layout of these event selection MSRs varies slightly by micro-architecture. The number of counters available varies by CPU and is dynamically checked by reading CPUID.0AH:EAX[15:8]. The performance counter MSRs (IA32_PMCx) start at address 0xc1 and also span a contiguous MSR region. The counters have an micro-architecture-specific number of bits they support, found in CPUID.0AH:EAX[23:16]. Reading and writing these MSRs is done via the rdmsr and wrmsr instructions respectively.
Typically modern Intel processors support 4 PMCs, and thus will have 4 event selection MSRs (0x186, 0x187, 0x188, and 0x189) and 4 counter MSRs (0xc1, 0xc2, 0xc3, and 0xc4). Most processors have 48-bit performance counters. It’s important to dynamically detect this information!
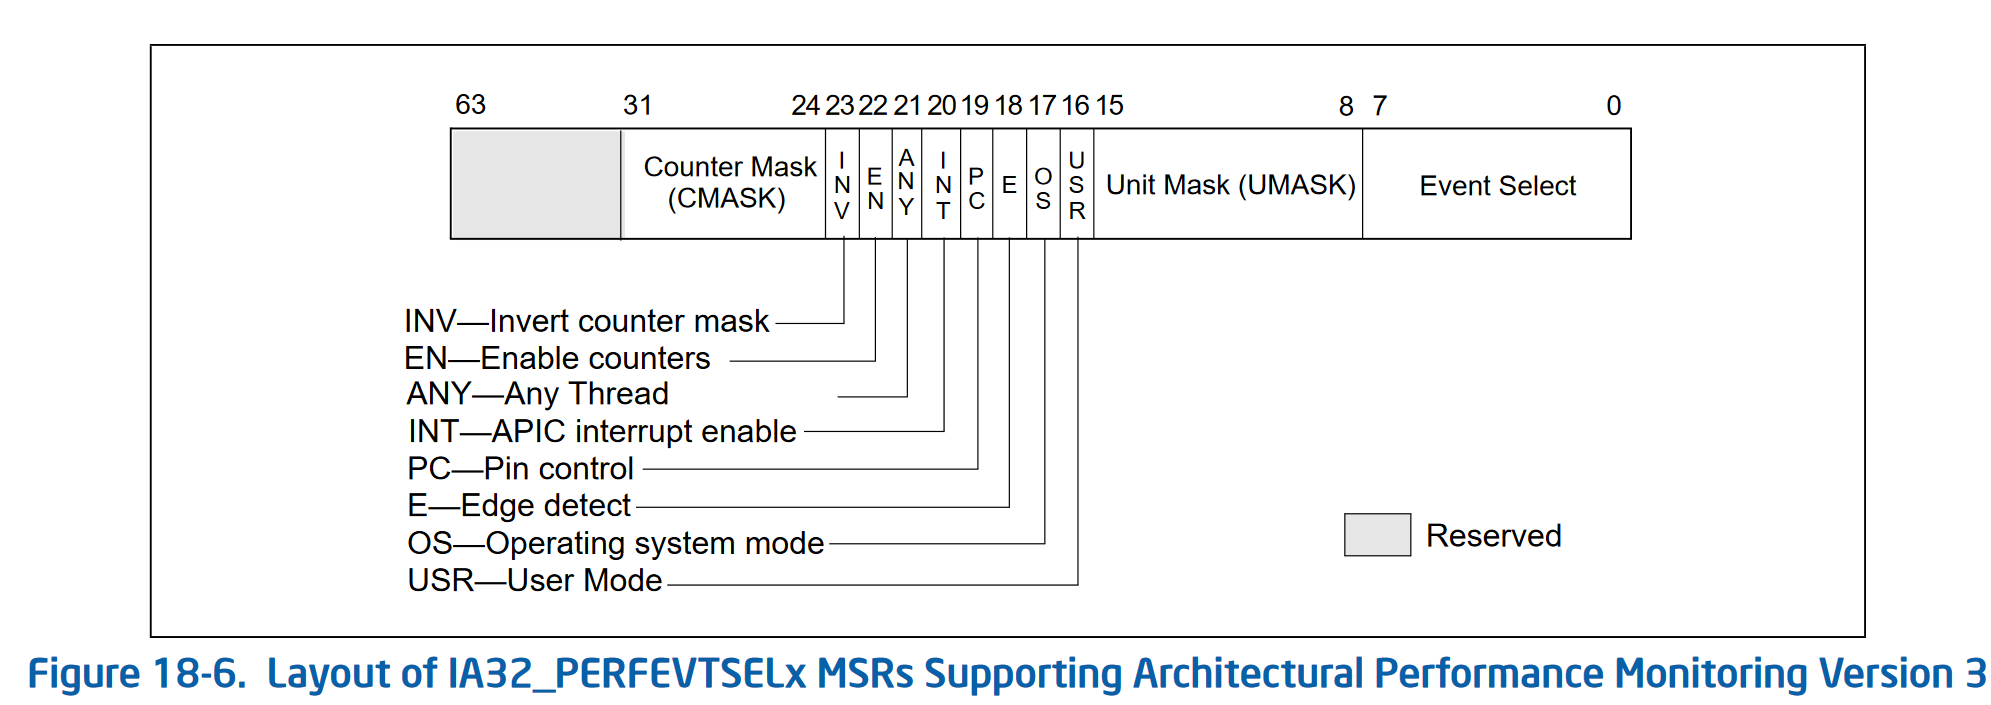
Here’s what the IA32_PERFEVTSELx MSR looks like for PMC version 3:
| Field | Meaning |
|---|---|
| Event Select | Holds the event number from the event tables, for the event you are interested in |
| Unit Mask | Holds the umask value from the event tables, for the event you are interested in |
| USR | If set, this counter counts during user-land code execution (ring level != 0) |
| OS | If set, this counter counts during OS execution (ring level == 0) |
| E | If set, enables edge detection of the event being tracked. Counts de-asserted to asserted transitions, which allows for timing of events |
| PC | Pin control allows for some hardware monitoring of events, like… the actual pins on the CPU |
| INT | Generate an interrupt through the APIC if an overflow occurs of the (usually 48-bit) counter |
| ANY | Increment the performance event when any hardware thread on a given physical core triggers the event, otherwise it only increments for a single logical thread |
| EN | Enable the counter |
| INV | Invert the counter mask, which changes the meaning of the CMASK field from a >= comparison (if this bit is 0), to a < comparison (if this bit is 1) |
| CMASK | If non-zero, the CPU only increments the performance counter when the event is triggered >= (or < if INV is set) CMASK times in a single cycle. This is useful for filtering events to more specific situations. If zero, this has no effect and the counter is incremented for each event |
And that’s about it! Find the right event you want to track in your specific micro-architecture’s table, program it in one of the IA32_PERFEVTSELx registers with the correct event number and umask, set the USR and/or OS bits depending on what type of code you want to track, and set the E bit to enable it! Now the corresponding IA32_PMCx counter will be incrementing every time that event occurs!
Reading the PMC counts faster
Instead of performing a rdmsr instruction to read the IA32_PMCx values, instead a rdpmc instruction can be used. This instruction is optimized to be a little bit faster and supports a “fast read mode” if ecx[31] is set to 1. This is typically how you’d read the performance counters.
Performance Counters version 2
In the second version of performance counters, Intel added a bunch of new features.
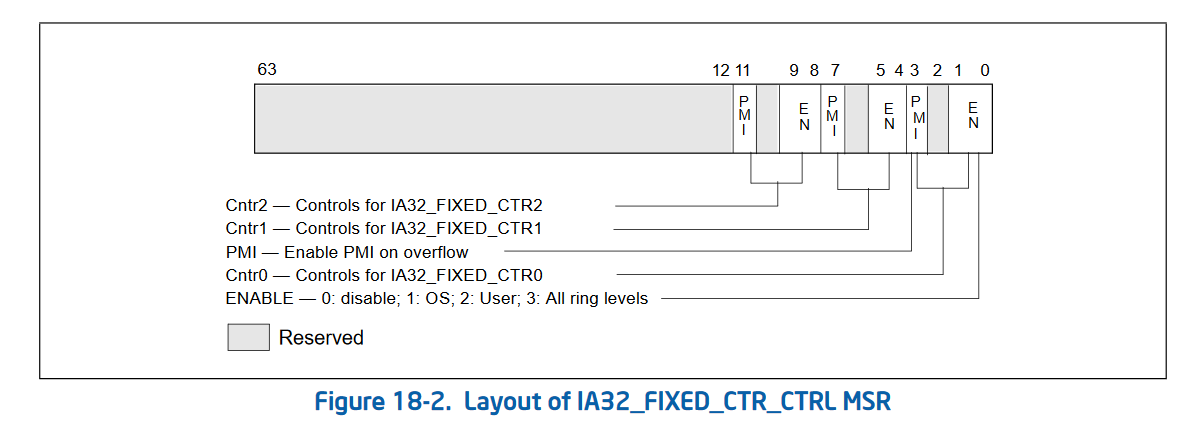
Intel added some fixed performance counters (IA32_FIXED_CTR0 through IA32_FIXED_CTR2, starting at address 0x309) which are not programmable. These are configured by IA32_FIXED_CTR_CTRL at address 0x38d. Unlike normal PMCs, these cannot be programmed to count any event. Rather the controls for these only allows the selection of which CPU ring level they increment at (or none to disable it), and whether or not they trigger an interrupt on overflow. No other control is provided for these.
| Fixed Performance Counter | MSR | Meaning |
|---|---|---|
| IA32_FIXED_CTR0 | 0x309 | Counts number of retired instructions |
| IA32_FIXED_CTR1 | 0x30a | Counts number of core cycles while the processor is not halted |
| IA32_FIXED_CTR2 | 0x30b | Counts number of timestamp counts (TSC) while the processor is not halted |
These are then enabled and disabled by:
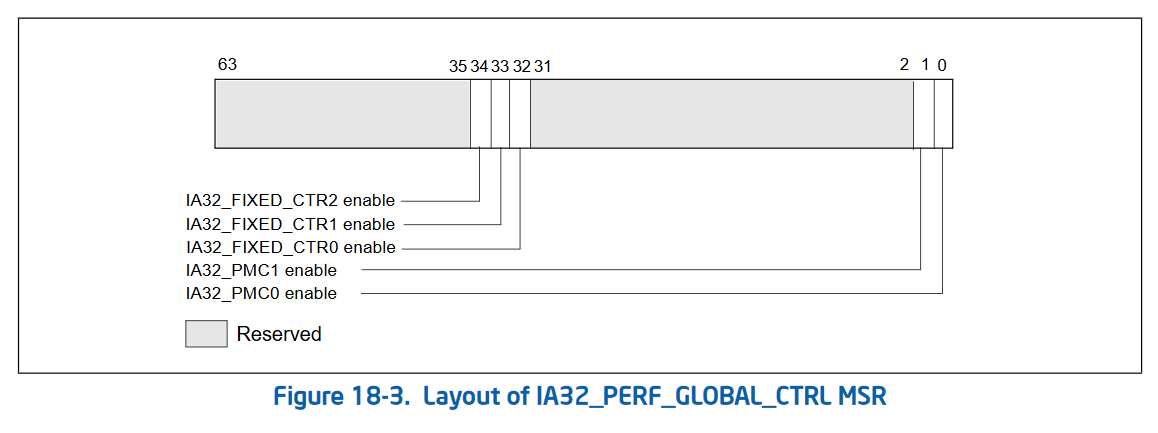
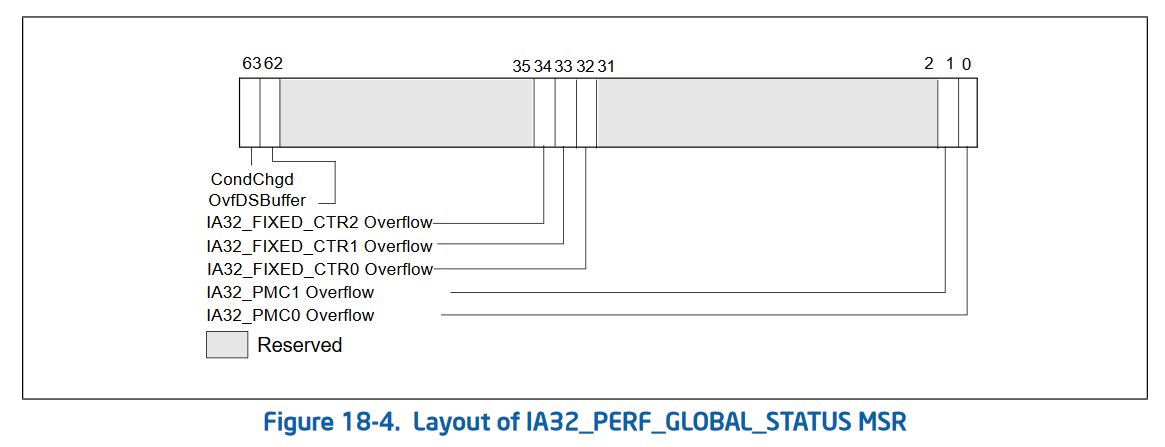
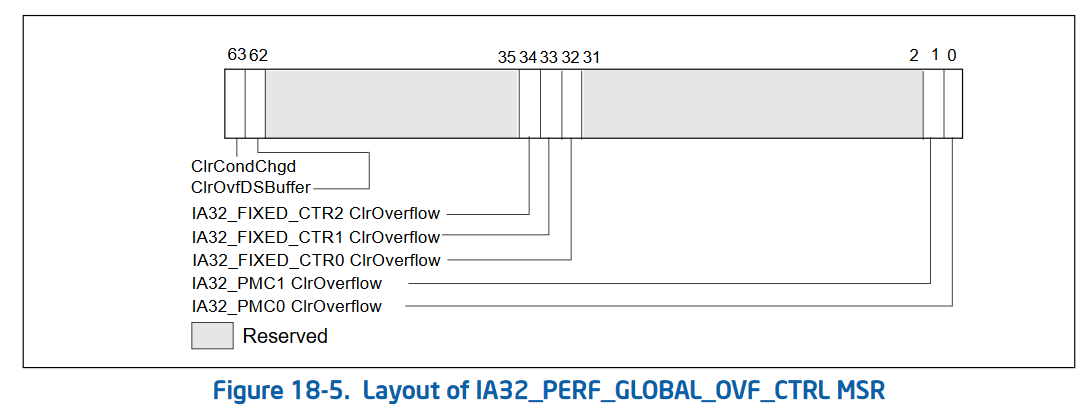
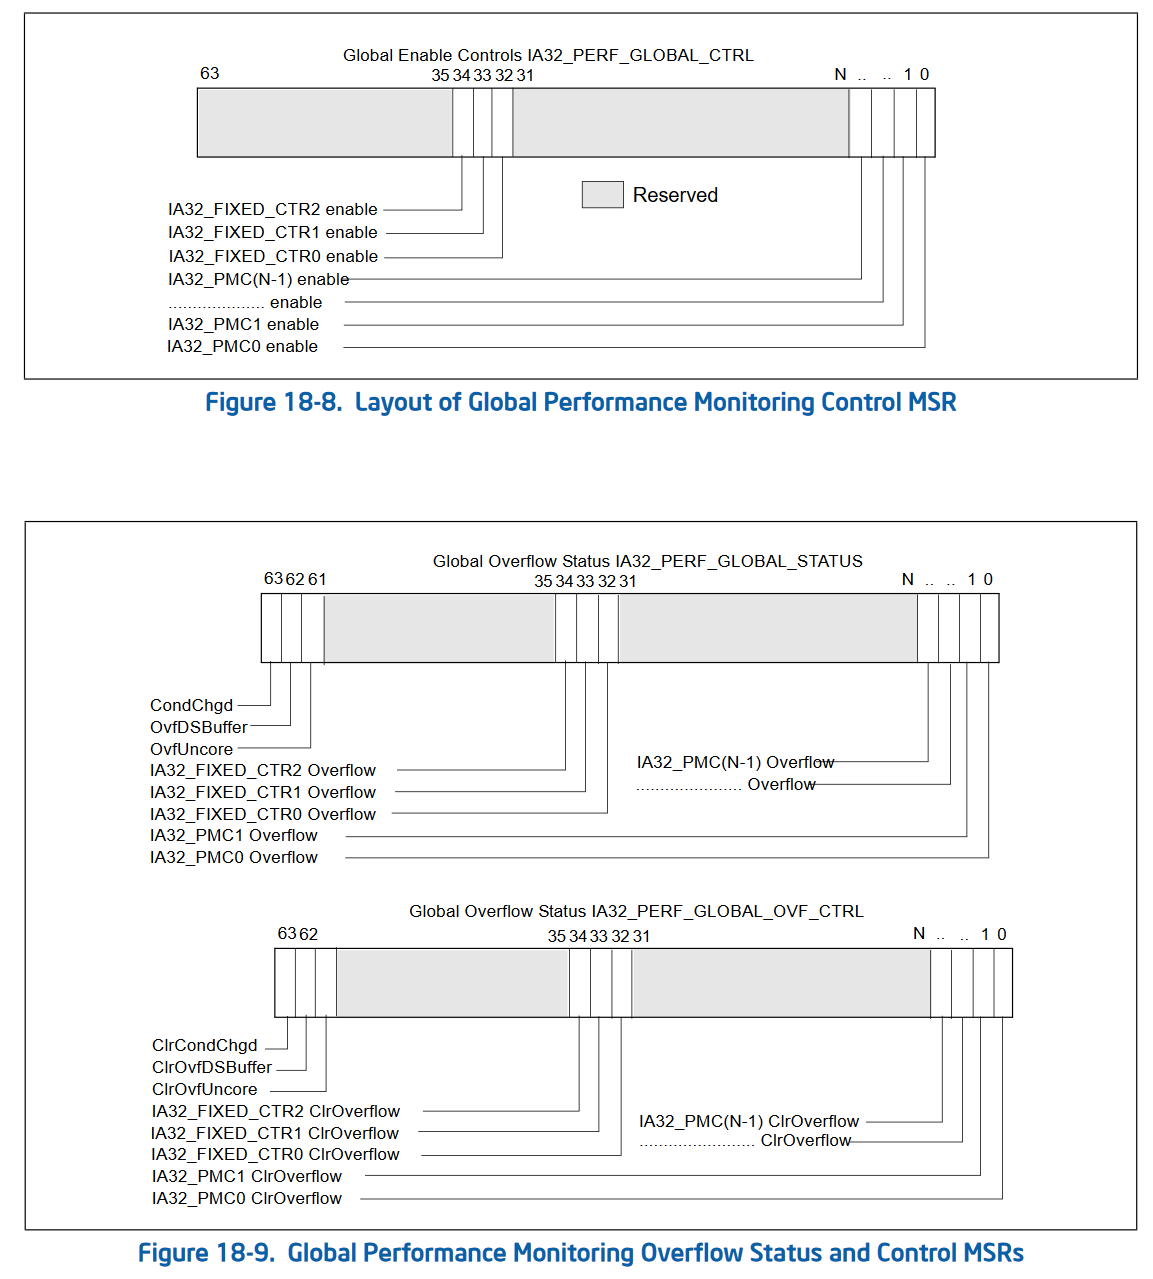
The second version of performance counters also added 3 new MSRs that allow “bulk management” of performance counters. Rather than checking the status and enabling/disabling each performance counter individually, Intel added 3 global control MSRs. These are IA32_PERF_GLOBAL_CTRL (address 0x38f) which allows enabling and disabling performance counters in bulk. IA32_PERF_GLOBAL_STATUS (address 0x38e) which allows checking the overflow status of all performance counters in one rdmsr. And IA32_PERF_GLOBAL_OVF_CTRL (address 0x390) which allows for resetting the overflow status of all performance counters in one wrmsr. Since rdmsr and wrmsr are serializing instructions, these can be quite expensive and being able to reduce the amount of them is important!
Global control (simple, allows masking of individual counters from one MSR):
Status (tracks overflows of various counters, with a global condition changed tracker):
Status control (writing a 1 to any of these bits clears the corresponding bit in IA32_PERF_GLOBAL_STATUS):
Finally, Intel added 2 bits to the existing IA32_DEBUGCTL MSR (address 0x1d9). These 2 bits Freeze_LBR_On_PMI (bit 11) and Freeze_PerfMon_On_PMI (bit 12) allow freezing of last branch recording (LBR) and performance monitoring on performance monitor interrupts (often due to overflows). These are designed to reduce the measurement of the interrupt itself when an overflow condition occurs.
Performance Counters version 3
Performance counters version 3 was pretty simple. Intel added the ANY bit to IA32_PERFEVTSELx and IA32_FIXED_CTR_CTRL to allow tracking of performance events on any thread on a physical core. Further, the performance counters went from a fixed number of 2 counters, to a variable amount of counters. This resulted in more bits being added to the global status, overflow, and overflow control MSRs, to control the corresponding counters.
Performance Counters version 4
Performance counters version 4 is pretty complex in detail, but ultimately it’s fairly simple. Intel renamed some of the MSRs (for example IA32_PERF_GLOBAL_OVF_CTRL became IA32_PERF_GLOBAL_STATUS_RESET). Intel also added a new MSR IA32_PERF_GLOBAL_STATUS_SET (address 0x391) which instead of clearing the bits in IA32_PERF_GLOBAL_STATUS, allows for setting of the bits.
Further, the freezing behavior enabled by IA32_DEBUGCTL.Freeze_LBR_On_PMI and IA32_DEBUGCTL.Freeze_PerfMon_On_PMI was streamlined to have a single bit which tracks the “freeze” state of the PMCs, rather than clearing the corresponding bits in the IA32_PERF_GLOBAL_CTRL MSR. This change is awesome as it reduces the cost of freezing and unfreezing the performance monitoring unit (PMU), but it’s actually a breaking change from previous versions of performance counters.
Finally, they added a mechanism to allow sharing of performance counters between multiple users. This is not really relevant to anything we’re going to talk about, so we won’t go into details.
Conclusion
Performance counters started off pretty simple, but Intel added more and more features over time. However, these “new” features are critical to what we’re about to do next :)
Cycle-by-cycle micro-architectural sampling
Now that we’ve gotten some prerequisites out of the way, lets talk about the main course of this blog: A creative use of performance counters to get cycle-by-cycle micro-architectural information out of Intel CPUs!
It’s important to note that this technique is meant to assist in finding and learning things about CPUs. The data it generates is not particularly easy to interpret or work with, and there are many pitfalls to be aware of!
The Goal
Performance counters are incredibly useful in categorizing micro-architectural behavior on an Intel CPU. However, these counters are often used on a block or whole program entirely, and viewed as a single data point over the whole run. For example, one might use performance counters to track the number of times there’s a cache miss in their program under test. This will give a single number as an output, giving an indication of how many times the cache was missed, but it doesn’t help much in telling you when they occurred. By some binary searching (or creative use of counter overflows) you can get a general idea of when the event occurred, but I wanted more information.
More specifically, I wanted to view micro-architectural data on a graph, where the x-axis was in cycles. This would allow me to see (with cycle-level granularity) when certain events happened in the CPU.
The Idea
We’ve set a pretty lofty goal for ourselves. We effectively want to link two performance counters with each other. In this case we want to use an arbitrary performance counter for some event we’re interested in, and we want to link it to a performance counter tracking the number of cycles elapsed. However, there doesn’t seem to be a direct way to perform this linking.
We know that we can have multiple performance counters, so we can configure one to count a given event, and another to count cycles. However, in this case we’re not able to capture information at each cycle, as we have no way of reading these counters together. We also cannot stop the counters ourselves, as stopping the counters requires injecting a wrmsr instruction which cannot be done on an arbitrary cycle boundary, and definitely cannot be done during speculation.
But there’s a small little trick we can use. We can stop multiple performance counters at the same time by using the IA32_DEBUGCTL.Freeze_PerfMon_On_PMI feature. When a counter ends up overflowing, an interrupt occurs (if configured as such). When this overflow occurs, the freeze bit in IA32_PERF_GLOBAL_STATUS is set (version 4 PMCs specific feature), causing all performance counters to stop.
This means that if we can cause an overflow on each cycle boundary, we could potentially capture the time and the event we’re interested in at the same time. Doing this isn’t too difficult either, we can simply pre-program the performance counter value IA32_PMCx to N away from overflow. In our specific case, we’re dealing with a 48-bit performance counter. So in theory if we program PMC0 to count number of cycles, set the counter to 2^48 - N where N is >= 1, we can get an interrupt, and thus an “atomic” disabling of performance counters after N cycles.
If we set up a deterministic enough execution environment, we can run the same code over and over, while adjusting N to sample the code at a different cycle count.
This relies on a lot of assumptions. We’re assuming that the freeze bit ends up disabling both performance counters at the same time (“atomically”), we’re assuming we can cause this interrupt on an arbitrary cycle boundary (even during multi-cycle instructions), and we also are assuming that we can execute code in a clean enough environment where we can do multiple runs measuring different cycle offsets.
So… lets try it!
The Implementation
A simple pseudo-code implementation of this sampling method looks as such:
/// Number of times we want to sample each data point. This allows us to look
/// for the minimum, maximum, and average values. This also gives us a way to
/// verify that the environment we're in is deterministic and the results are
/// sane. If minimum == maximum over many samples, it's safe to say we have a
/// very clear picture of what is happening.
const NUM_SAMPLES: u64 = 1000;

/// Maximum number of cycles to sample on the x-axis. This limits the sampling
/// space.
const MAX_CYCLES: u64 = 1000;

// Program the APIC to map the performance counter overflow interrupts to a
// stub assembly routine which simply `iret`s out
configure_pmc_interrupts_in_apic();

// Configure performance counters to freeze on interrupts
perf_freeze_on_overflow();

// Iterate through each performance counter we want to gather data on
for perf_counter in performance_counters_of_interest {
    // Disable and reset all performance counters individually
    // Clearing their counts to 0, and clearing their event select MSRs to 0
    disable_all_perf_counters();

    // Disable performance counters globally by setting IA32_PERF_GLOBAL_CTRL
    // to 0
    disable_perf_globally();

    // Enable a performance counter (lets say PMC0) to track the `perf_counter`
    // we're interested in. Note that this doesn't start the counter yet, as we
    // still have the counters globally disabled.
    enable_perf_counter(perf_counter);

    // Go through each number of samples we want to collect for this performance
    // counter... for each cycle offset.
    for _ in 0..NUM_SAMPLES {
        // Go through each cycle we want to observe
        for cycle_offset in 1..=MAX_CYCLES {
            // Clear out the performance counter values: IA32_PMCx fields
            clear_perf_counters();

            // Program fixed counter #1 (un-halted cycle counter) to trigger
            // an interrupt on overflow. This will cause an interrupt, which
            // will then cause a freeze of all PMCs.
            program_fixed1_interrupt_on_overflow();

            // Program the fixed counter #1 (un-halted cycle counter) to
            // `cycles` prior to overflowing
            set_fixed1_value((1 << 48) - cycle_offset);

            // Do some pre-test environment setup. This is important to make
            // sure we can sample the code under test multiple times and get
            // the same result. Here is where you'd be flushing cache lines,
            // maybe doing a `wbinvd`, etc.
            set_up_environment();

            // Enable both the fixed #1 cycle counter and the PMC0 performance
            // counter (tracking the stat we're interested in) at the same time,
            // by using IA32_PERF_GLOBAL_CTRL. This is serializing so you don't
            // have to worry about re-ordering across this boundary.
            enable_perf_globally();

            asm!(r#"

                asm
                under
                test
                here

            "# :::: "volatile");

            // Clear IA32_PERF_GLOBAL_CTRL to 0 to stop counters
            disable_perf_globally();

            // If fixed PMC #1 has not overflowed, then we didn't capture
            // relevant data. This only can happen if we tried to sample a
            // cycle which happens after the assembly under test executed.
            if fixed1_pmc_overflowed() == false {
                continue;
            }

            // At this point we can do whatever we want as the performance
            // counters have been turned off by the interrupt and we should have
            // relevant data in both :)

            // Get the count from fixed #1 PMC. It's important that we grab this
            // as interrupts are not deterministic, and thus it's possible we
            // "overshoot" the target
            let fixed1_count = read_fixed1_counter();

            // Add the distance-from-overflow we initially programmed into the
            // fixed #1 counter, with the current value of the fixed #1 counter
            // to get the total number of cycles which have elapsed during
            // our example.
            let total_cycles = cycle_offset + fixed1_count;

            // Read the actual count from the performance counter we were using.
            // In this case we were using PMC #0 to track our event of interest.
            let value = read_pmc0();

            // Somehow log that performance counter `perf_counter` had a value
            // `value` `total_cycles` into execution
            log_result(perf_counter, value, total_cycles);
        }
    }
}
Simple results
So? Does it work? Let’s try with a simple example of code that just does a few “nops” by adjusting the stack a few times:
add rsp, 8
sub rsp, 8
add rsp, 8
sub rsp, 8

So how do we read this graph? Well, the x-axis is simple. It’s the time, in cycles, of execution. The y-axis is the number of events (which varies based on the key). In this case we’re only graphing the number of instructions retired (successfully executed).
So does this look right? Hmmm…. we ran 4 instructions, why did we see 8 retire?
Well in this case there’s a little bit of “extra” noise introduced by the harnessing around the code under test. Let’s zoom out from our code and look at what actually executes during our test:
; Right before test, we end up enabling all performance counters at once by
; writing 0x2_0000_000f to IA32_PERF_GLOBAL_CTRL. This enables all 4
; programmable counters at the same time as enabling fixed PMC #1 (cycle count)
00000000  B98F030000        mov ecx,0x38f ; IA32_PERF_GLOBAL_CTRL
00000005  B80F000000        mov eax,0xf
0000000A  BA02000000        mov edx,0x2
0000000F  0F30              wrmsr

; Here's our code under test :D
00000011  4883C408          add rsp,byte +0x8
00000015  4883EC08          sub rsp,byte +0x8
00000019  4883C408          add rsp,byte +0x8
0000001D  4883EC08          sub rsp,byte +0x8

; And finally we disable all counters by setting IA32_PERF_GLOBAL_CTRL to 0
00000021  B98F030000        mov ecx,0x38f
00000026  31C0              xor eax,eax
00000028  31D2              xor edx,edx
0000002A  0F30              wrmsr
So if we take another look at the graph, we see there are 8 instructions that retired. The very first instruction we see retire (at cycle=11), is actually the wrmsr we used to enable the counters. This makes sense, at some point prior to retirement of the wrmsr instruction the counters must be enabled internally somewhere in the CPU. So we actually get to see this instruction retire!
Then we see 7 more instructions retire to give us a total of 8… hmm. Well, we have 4 of our add and sub mix that we executed, so that brings us down to 3 more remaining “unknown” instructions.
These 3 remaining instructions are explained by the code which disables the performance counter after our test code has executed. We have 1 mov, and 2 xor instructions which retire prior to the wrmsr which disables the counters. It makes sense that we never see the final wrmsr retire as the counters will be turned off in the CPU prior to the wrmsr instruction retiring!
Wala! It all makes sense. We now have a great view into what the CPU did in terms of retirement for this code in question. Everything we saw lined up with what actually executed, always good to see.
A bit more advanced result
Lets add a few more performance counters to track. In this case lets track the number of instructions retired, as well as the number of micro-ops dispatched to port 4 (the store port). This will give us the number of stores which occurred during test.
Code to test (just a few writes to the stack):
; Right before test, we end up enabling all performance counters at once by
; writing 0x2_0000_000f to IA32_PERF_GLOBAL_CTRL. This enables all 4
; programmable counters at the same time as enabling fixed PMC #1 (cycle count)
00000000  B98F030000        mov ecx,0x38f
00000005  B80F000000        mov eax,0xf
0000000A  BA02000000        mov edx,0x2
0000000F  0F30              wrmsr

00000011  4883EC08          sub rsp,byte +0x8
00000015  48C7042400000000  mov qword [rsp],0x0
0000001D  4883C408          add rsp,byte +0x8
00000021  4883EC08          sub rsp,byte +0x8
00000025  48C7042400000000  mov qword [rsp],0x0
0000002D  4883C408          add rsp,byte +0x8

; And finally we disable all counters by setting IA32_PERF_GLOBAL_CTRL to 0
00000031  B98F030000        mov ecx,0x38f
00000036  31C0              xor eax,eax
00000038  31D2              xor edx,edx
0000003A  0F30              wrmsr

This one is fun. We simply make room on the stack (sub rsp), write a 0 to the stack (mov [rsp]), and then restore the stack (add rsp), and then do it all again one more time.
Here we added another plot to the graph, Port 4, which is the store uOP port on the CPU. We also track the number of instructions retired, as we did in the first example. Here we can see instructions retired matches what we would expect. We see 10 retirements, 1 from the first wrmsr enabling the performance counters, 6 from our own code under test, and 3 more from the disabling of the performance counters.
This time we’re able to see where the stores occur, and indeed, 2 stores do occur. We see a store happen at cycle=28 and cycle=29. Interestingly we see the stores are back-to-back, even though there’s a bit of code between them. We’re probably observing some re-ordering! Later in the graph (cycle=39), we observe that 4 instructions get retired in a single cycle! How cool is that?!
How deep can we go?
Using the exact same store example from above, we can enable even more performance counters. This gives us an even more detailed view of different parts of the micro-architectural state.

In this case we’re tracking all uOP port activity, machine clears (when the CPU resets itself after speculation), offcore requests (when messages get sent offcore, typically to access physical memory), instructions retired, and branches retired. In theory we can measure any possible performance counter available on our micro-architecture on a time domain. This gives us the ability to see almost anything that is happening on the CPU!
Noise…
In all of the examples we’ve looked at, none of the data points have visible error bars. In these graphs the error bars represent the minimum value, mean value, and maximum value observed for a given data point. Since we’re running the same code over and over, and sampling it at different execution times, it’s very possible for “random” noise to interfere with results. Let’s look at a bit more noisy example:
; Right before test, we end up enabling all performance counters at once by
; writing 0x2_0000_000f to IA32_PERF_GLOBAL_CTRL. This enables all 4
; programmable counters at the same time as enabling fixed PMC #1 (cycle count)
00000000  B98F030000        mov ecx,0x38f
00000005  B80F000000        mov eax,0xf
0000000A  BA02000000        mov edx,0x2
0000000F  0F30              wrmsr

00000011  48C7042500000000  mov qword [0x0],0x0
         -00000000
0000001D  48C7042500000000  mov qword [0x0],0x0
         -00000000
00000029  48C7042500000000  mov qword [0x0],0x0
         -00000000
00000035  48C7042500000000  mov qword [0x0],0x0
         -00000000

; And finally we disable all counters by setting IA32_PERF_GLOBAL_CTRL to 0
00000041  B98F030000        mov ecx,0x38f
00000046  31C0              xor eax,eax
00000048  31D2              xor edx,edx
0000004A  0F30              wrmsr
Here we’re just going to write to NULL 4 times. This might sound bad, but in this example I mapped NULL in as normal write-back memory. Nothing crazy, just treat it as a valid address.
But here are the results:

Hmmm… we have error bars! We see the stores always get dispatched at the same time. This makes sense, we’re always doing the same thing. But we see that some of the instructions have some variance in where they retire. For example, at cycle=38 we see that sometimes at this point 2 instructions have been retired, other times 4 have been retired, but on average a little over 3 instructions have been retired at this point. This tells us that the CPU isn’t always deterministic in this environment.
These results can get a bit more complex to interpret, but it’s still relevant data nevertheless. Changing the code under test, cleaning up to the environment to be more determinsitic, etc, can often improve the quality and visibility of the data.
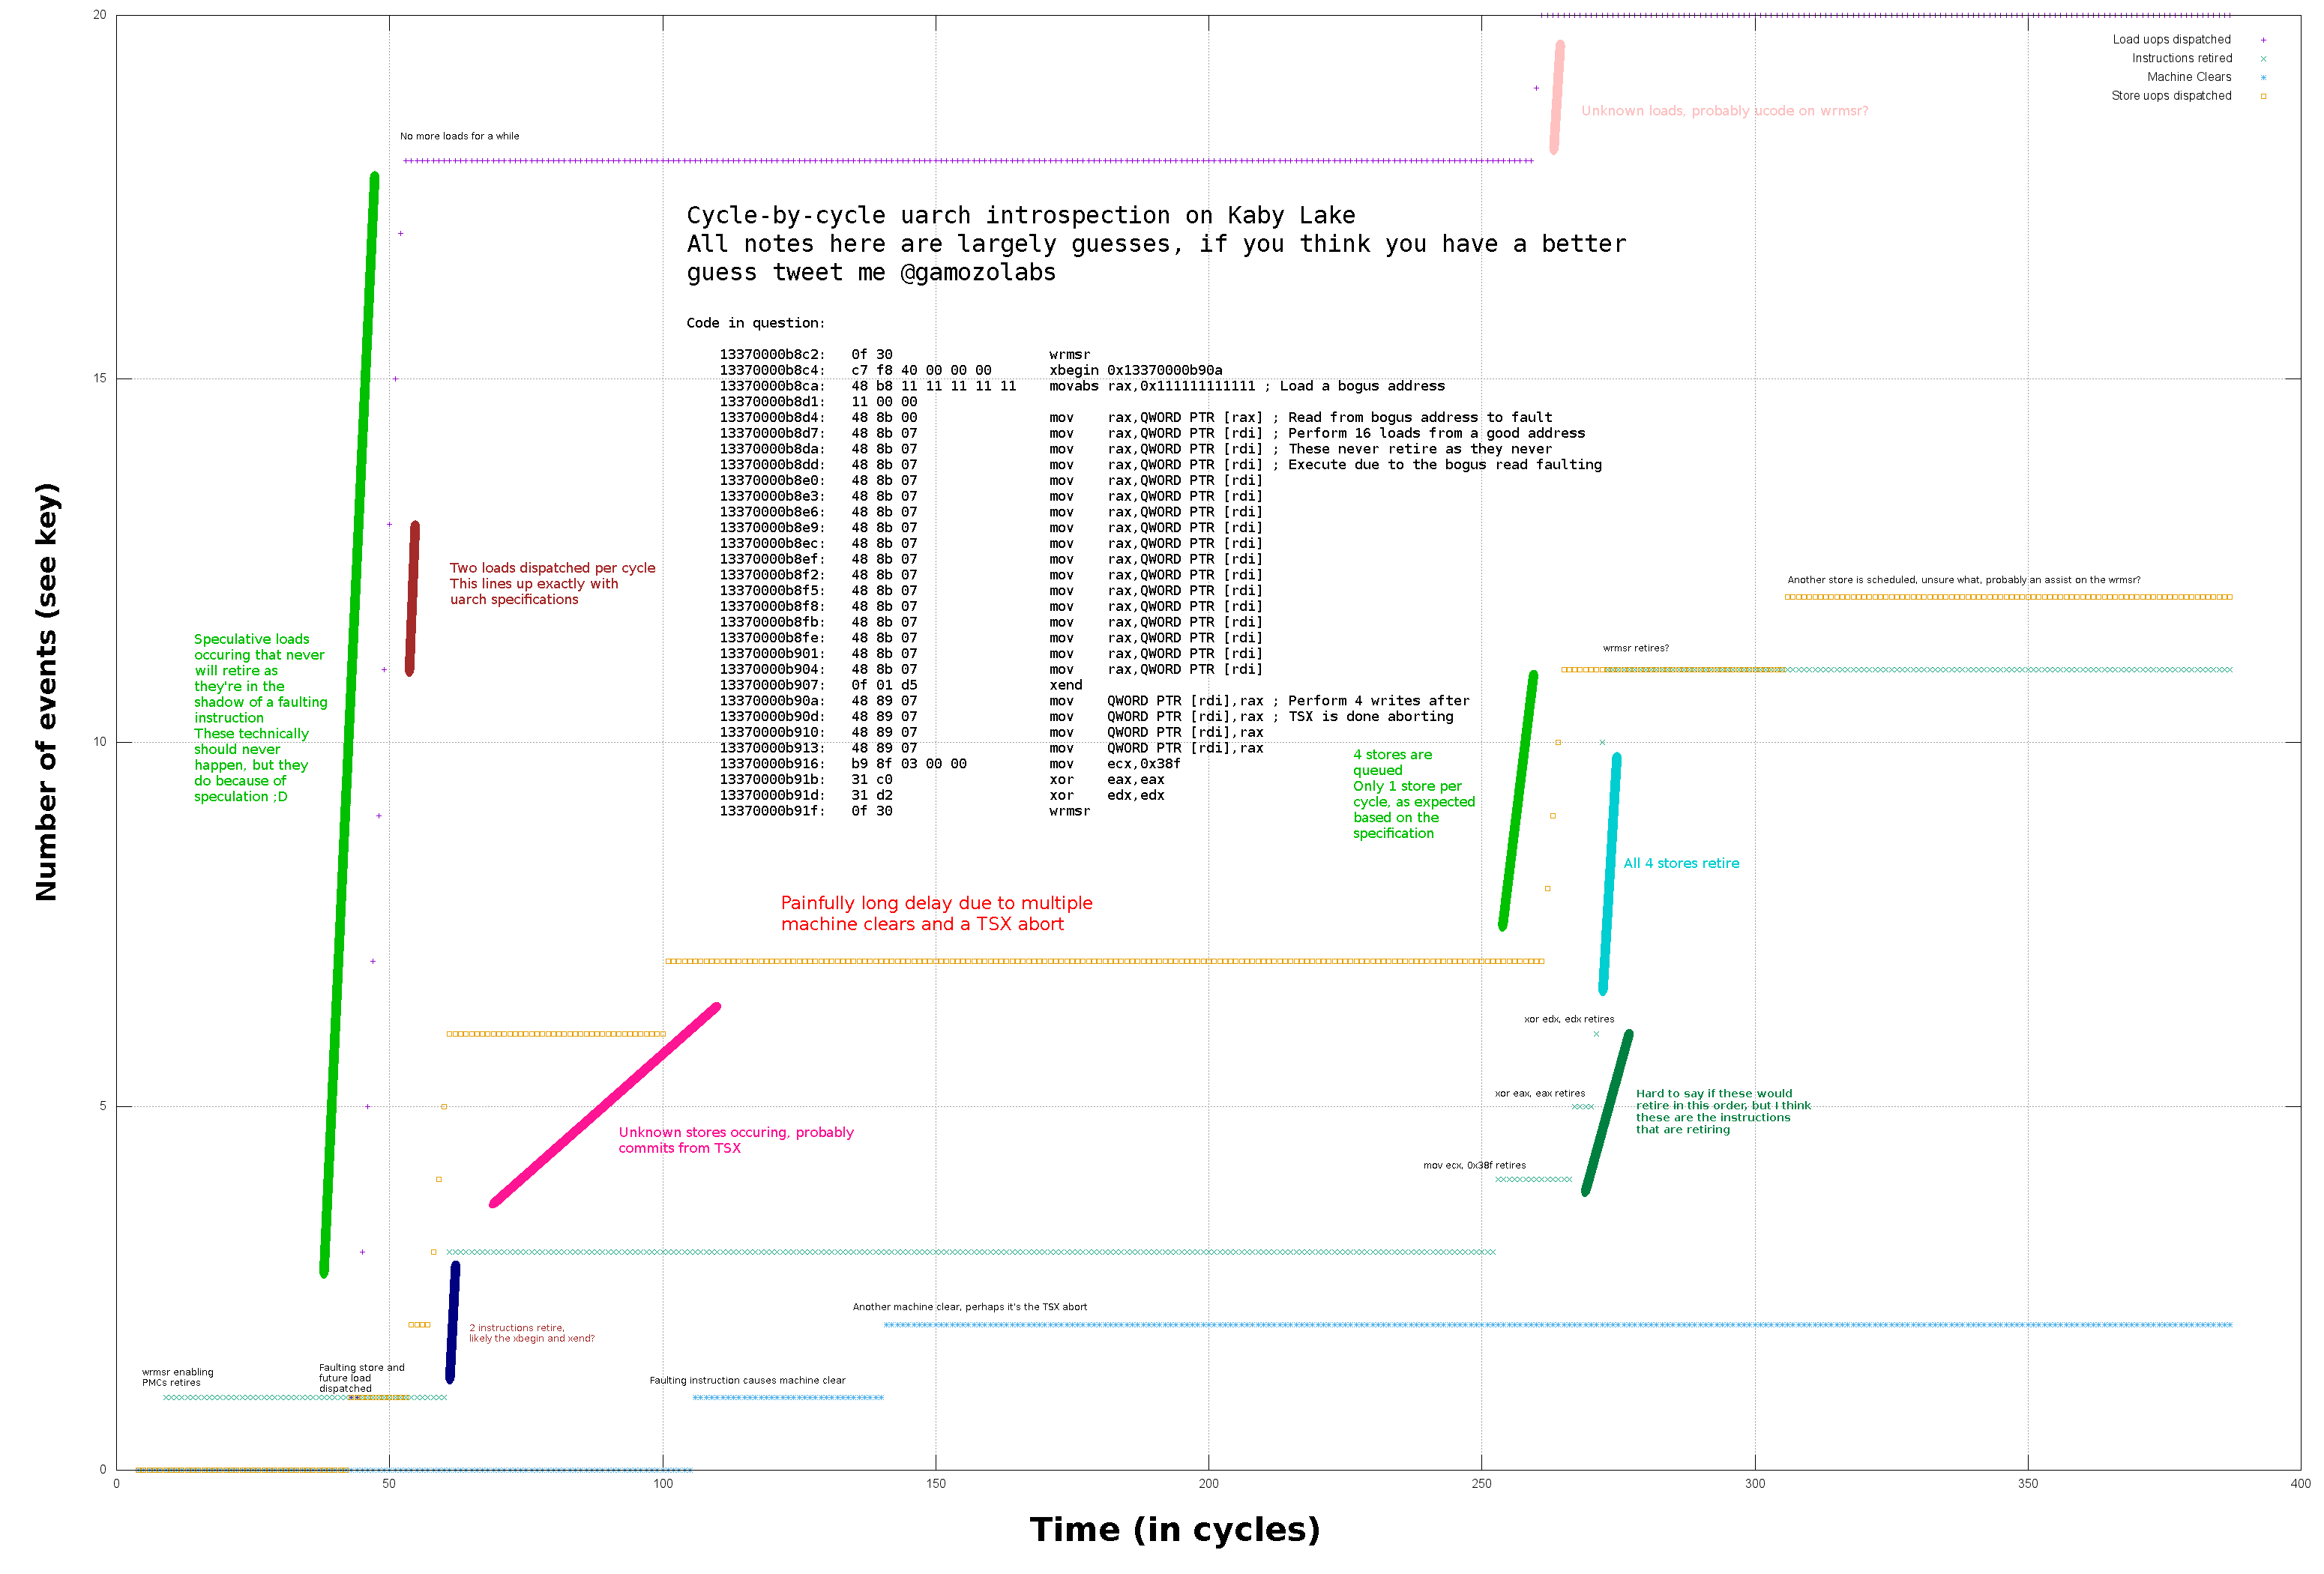
Does it work with speculation?
Damn right it does! That was the whole point!
Let’s cause a fault, perform some loads behind it, and see if we can see the loads get issued even though the entire section of code is discarded.
    // Start a TSX section, think of this as a `try {` block
    xbegin 2f

    // Read from -1, causing a fault
    mov rax, [-1]

    // Here's some loads shadowing the faulting load. These
    // should never occur, as the instruction above causes
    // an exeception and thus execution should "jump" to the label `2:`

    .rept 32
        // Repeated load 32 times
        mov rbx, [0]
    .endr

    // End the TSX section, think of this as a `}` closing the
    // `try` block
    xend

2:
    // Here is where execution goes if the TSX section had
    // an exception, and thus where execution will flow

Both ports 2 and port 3 are load ports. We see both of them taking turns handling loads (1 load per cycle each, with 2 ports, 2 loads per cycle total). Here we can see many different loads get dispatched, even though very few instructions actually retire. What we’re viewing here is the micro-architecture performing speculation! Neat!
More data?
I could go on and on graphing different CPU behaviors! There’s so much cool stuff to explore out there. However, this blog has already gotten longer than I wanted, so I’ll stop here. Maybe I’ll make future small blogs about certain interesting behaviors!
Conclusion
This technique of measuring performance counters on a time-domain seems to work quite well. You have to be very careful with noise, but with careful interpretation of the data, this technique provides the highest level of visibility into the Intel micro-architecture that I’ve ever seen!
This tool is incredibly useful for validating hypothesises about behaviors of various Intel micro-architectures. By running multiple experiments on different behaviors, a more macro-level model can be derived about the inner workings of the CPU. This could lead to learning new optimization techniques, finding new CPU vulnerabilities, and just in general having fun learning how things work!
Source?
Update: 8/19/2019
This kernel has too many sensitive features that I do not want to make public at this time…
However, it seems there’s a lot of interest in this tech, so I will try to live stream soon adding this functionality to my already-open-source kernel Orange Slice!