Some thoughts on fuzzing
Foreward
This blog is a bit weird, this is actually a message I posted in response to a fuzzbench issue, but honestly, I think it warranted a blog, even if it’s a bit unpolished!
You can find the discussion at fuzzbench issue tracker #654
Social
I’ve been streaming a lot more regularly on my Twitch! I’ve developed hypervisors for fuzzing, mutators, emulators, and just done a lot of fun fuzzing work on stream. Come on by!
Follow me at @gamozolabs on Twitter if you want notifications when new blogs come up. I often will post data and graphs from data as it comes in and I learn!
The blog
Hello again Today!
So, I’d like to address a few things that I’ve thought of a bit more over time and want to emphasize.
Visualizations, and what I’m often looking for in data
When it comes to visualizations, I don’t really mind much which graphs are displayed by default, linear vs logscale, time-based or per-case-based, but they should both be toggleable in the default. I’m not web dev, but having an interactive graph would be pretty nice, allowing for turning on and off of certain lines, zooming in and out, and changing scales/axes. But, I think we’re in agreement here. I personally believe that logscale should be default, and I don’t see how it’s anything but better, unless you only care about seeing where things “flatten out”. But in that case, it’s just as visible in logscale, you just have to be logscale aware.
Here’s an example of typically what I graph when I’m running and tuning a fuzzer. I’m using doing side-by-side comparisons of small fuzzer tweaks, to my prior best runs, and plotting both on a time domain and a fuzz case domain. I’ve included the linear-scale plots just for comparison with the way we currently do things, but I personally never use linear scale as I just find it to be worse in all aspects.
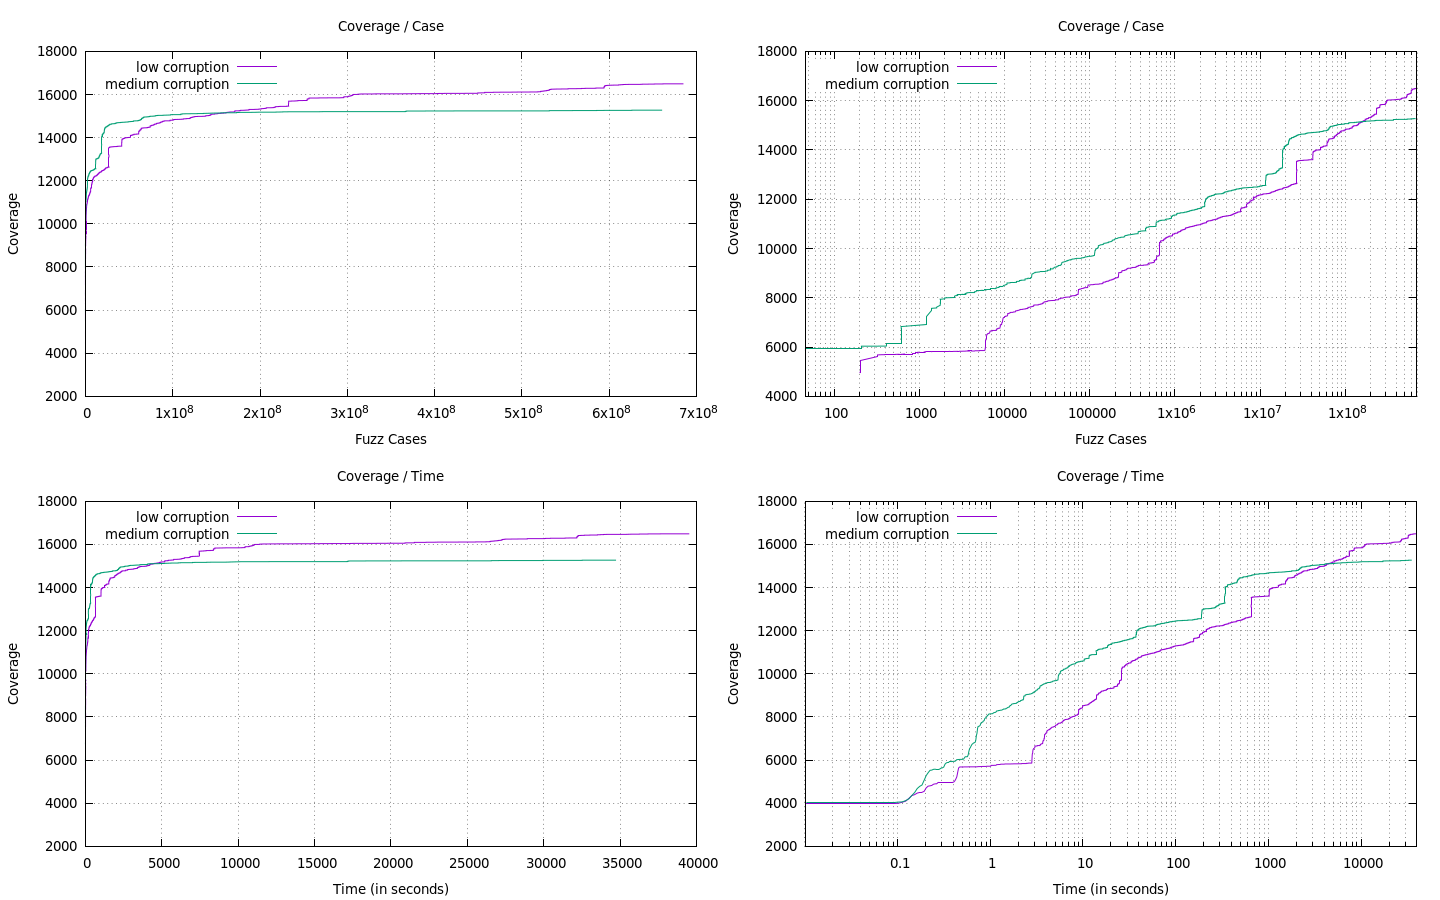
By using a linear scale, we’re unable to see anything about what happens in the fuzzer in the first ~20 min or so. We just see a vertical line. In the log scale we see a lot more which is happening. This graph is comparing a fuzzer which does rand() % 20 rounds of mutation (medium corruption), versus rand % 5 rounds of the same corruption (low corruption). We can see that early on medium corruption has much better properties, as it explores more aggressively. But there’s actually a point where they cross, and this is likely the point where the corruption becomes too great on average in the medium corruption, and ends up “ruining” previously good inputs, dramatically reducing the frequency we see good cases. It’s important to note, that since the medium corruption is a superset of low corruption (eg, there’s a chance to do low corruption), both graphs would eventually converge to the exact same value.
There’s just so much information in this graph that stands out to me. I see that something about medium corruption performs well in the first ~100 seconds. There’s a really good lead at the early few seconds, and it tapers off throughout. This gives me feedback on maybe when and where I should use this level of corruption.
Further, since I have both a fuzz case graph and a time graph, I can see that medium corruption early on actually has better performance than low corruption. Once again, this makes sense, the more corruption, the more likely you are to make a more invalid input which is parsed more shallow. But from the coverage over case, I see that this isn’t a long term thing and eventually the performance seems to converge between the two. It’s important to note, the intersection point of the two lines varies by quite a bit in both the case domain and the time domain. This tells me that even though I just changed the mutator, it has affected the performance, likely due to the depth of the average input in the corpus, really neat!
Example analysis conclusion
I see that medium corruption in this case is giving me about 10x speedup in time-to-same-coverage, and also some performance benefits early on. I should adopt a dynamic corruption model which tunes this corruption amount maybe against time, or ideally, some other metric I could extract from the target or stats. I see that long-term, the low corruption starts to win, and for something that I’d run for a week, I’d much rather run the low corruption.
Even though this program is very simple, these graphs could pretty arbitrary be stretched out to different time axis. If fuzzbench picks a deadline, for example, 1000 seconds, we would never know this about the fuzzer performance. I think this is likely what many fuzzers are now being tuned to, as the benchmarks often are 12/24/72 hour increments. Fuzzers often get some extra blips even deeper in the runs, and it’s really hard to estimate if these crosses would ever occur.
The case for cases
I personally extract most information from graphs which are plotted against number of fuzz cases rather than time. By doing benchmarks in a time domain, you factor in the performance of the fuzzer. This is this ground truth, and what really matters at the end of the day with complete products. But it’s not the ground truth for fuzzers in development. For example, if I wanted to prototype a new mutation strategy for AFL, I would be forced to do it in C, avoid inefficient copies, avoid mallocs, etc. I effectively have to make sure my mutator is at-or-better than existing AFL mutator performance to use benchmarks like this.
When you do development on fuzz cases, you can start to inspect the efficiency of the fuzzer in terms of quality of cases produced. I could prototype a mutator in python for all I care, and see if it performs better than the stock AFL mutators. This allows me to cut corners and spend 1 day trying out a mutator, rather than 1 month making a mutator and then doing complex optimizations to make it work. During early stages of development, I would expect a developer to understand the ramifications of making it faster, and to have a ballpark idea of where it could be if the O(n^3) logic was turned into O(log n), and whether it’s possible.
Often times, the first pass of an attempt is going to be crude, and for no reason other than laziness (and not in a negative way)! There’s a time and a place to polish and optimize a technique, and it’s important that there can be information learned from very preliminary results. Most performance in standard feedback mechanisms and mutation strategies can be solved with a little bit of engineering, and most developers should be able to gauge the best-case big-O for their strategy, even if that’s not the algorithmic complexity of their initial implementation.
Yep, looking at coverage over cases adds nuance, but I think we can handle it. Given most fuzzing tools, especially initial passes, are already so un-optimized, I’m really not worried about any performance differences in AFL/libfuzzer/etc when it comes to single-core performance.
Scaling
Scaling of performance is really missing from fuzzbench. At every company I’ve worked at, big and small, even for the most simple targets we’re fuzzing we’re running at least ~50-100 cores. I presume (I don’t know for sure) that fuzzbench is comparing single core performance. That’s great, it’s a useful stat and one I often control for, as single-core, coverage/case is often controlled for both scaling and performance, leading to great introspection into the raw logic of the fuzzer.
However, in reality, the scaling of these tools is critical for actual use. If AFL is 20% faster single-core, that’ll likely make it show up at the top of fuzzbench, given relative parity of mutation strategies. That’s great, the performance takes engineering effort and should not be undervalued. In fact, most of my research is focused around making fuzzers fast, I’ve got multiple fuzzers that can handle 10s of billions of fuzz cases per second on a single machine. It’s a lot of work to make these tools scale, much more so than single-core performance, which is often algorithmic fixes.
If AFL is 20% faster single-core, but bottlenecks on fork(), or write(), and thus only scales to 20-30 cores (often where I see AFL really fall apart, on medium size targets, 5-10 cores for small targets). But something like libfuzzer manages things in memory and can scale linearly with as many cores as you throw it, libfuzzer is going to blow away any 20% performance gains seen single-core.
This information is very hard to benchmark. Well, not hard, but costly. Effectively, I’d like to see benchmarks of fuzzers scaled to ~16 cores on a single server, and ~128 cores distributed across at least 4 servers. This benchmarks. A. the possibility the fuzzer can scale in the first place, if it can’t that’s a big hit to real-world usability. B. the possibility it can scale across servers (often, over the network). Things like AFL-over-SMB would have brutal scaling properties here. C. the scalability properties between cores on the same server, and how they transfer over the network.
I find it very unlikely that these fuzzers being benchmarked even remotely have similar scaling properties. AFL struggles to scale even on a single server, even in persistent mode, due to the heavy use of syscalls and blocking IPC every fuzz case (signal(), read(), write(), per case IIRC, ~3-4 syscalls).
Scaling also puts a lot of pressure on infeasible fuzzing strategies proposed in papers. We’ve all seen them, the high-introspection techniques which extract memory, register, taint state from a small program and promise great results. I don’t disagree with the results, the more information you extract, pretty much directly correlates to an increase in coverage/case. But, eventually the data load gets very hard to share between cores, queue between servers, and even just process.
Measuring symbolic
Measuring symbolic was brought up a few times, as it would definitely have a much better coverage/case than a traditional fuzzer. But this nuance can easily be handled by looking at both coverage/case and coverage/time graphs. Learning what works well algorithmicly should drive our engineering efforts to solve problems. While symbolic may have huge performance issues, it’s very likely, that many of the parts of it (eg. taint tracking) can be approximated with lossy algorithms and data capturing, and it’s more about learning where it has strengths and weaknesses. Many of the analyses I’ve done on symbolic largely lead me to vectorized emulation, which allows for highly-compressed, approximated taint tracking, while still getting near-native (or even better) execution speeds.
The case against monolithic fuzzers
Learning what works is important to figure out where to invest our engineering time. Given the quality of code in fuzzing right now (often very poor), there’s a lot of things that I’d hate to see us rule out because our current methodologies do not support them. I really care about my reset times of fuzz cases, (often: the fork() costs), as well as determinism. In a fully deterministic environment, with fast resets, a lot of approximate strategies can be used. Trying to approximate where bytes came from in an input, flipping the bytes because you have a branch target which is interesting, and then smashing those bytes in can give good information about the relation of those bytes to the input. Hell, with fast resets and forking, you can do partial fuzzing where you fork() and snapshot multiple times during a fuzz case, and you can progressively fuzz “from” different points in the parser. This works especially well for protocols where you can snapshot at each packet boundary.
These sorts of techniques and analyses don’t really work when we have monolithic fuzzers. The performance of existing fuzzers is often quite poor (AFL fork(), etc), or does not support partial execution (persistent modes, libfuzzer, etc). This leads to us not being able to even research these techniques. As we keep bolting things onto existing fuzzers and treating them like big blobs, we’ll get further and further from being able to learn the isolated properties of fuzzers and find the best places to apply certain strategies.
Why I don’t care much about fuzzer performance for benchmarking
Reset speed
AFL fork() bottlenecks for me often around 10-20k execs/sec on a single core, and about 40-50k on the whole system, even with 96C/192T systems. This is largely due to just getting stuck on kernel allocations and locks. Spinning up processes is expensive, and largely out of our control. AFL allows access of the local system and kernel to the fuzz case, thus cases are not deterministic, nor are they isolated (in the case of fuzzing something with lock files). This requires using another abstraction layer like docker, which adds more overhead to the equation. My hypervisors that I use for fuzzing can reset a Windows VM 1 million times per second on a single core, and scale linearly with cores, while being deterministic. Why does this matter? Well, we’re comparing tooling which isn’t even remotely hitting the capabilities of the CPUs, rather they’re bottlenecking on the kernel. These are solvable problems, and thus, as a consumer of good ideas but not tooling, I’m interested in what works well. I can make it go fast myself.
Determinism
Most fuzzers that we work with now are not deterministic. You cannot expect instruction-for-instruction determinism between cases. This makes it a lot harder to use complex fuzzing strategies which may rely on the results of a prior execution being identical to a future one. This is largely an engineering problem, and can be solved in both system-level and app-level targets.
Mutation performance
The performance of mutators is often not what it can be. For example, honggfuzz used (now fixed, cheers!) temporary allocations during multiple passes. During its mangle_MemSwap it made a copy of the chunk that was to be swapped, performing 3 memcpys and using a temporary allocation. This logic was able to be implemented using a single memcpy and without a dynamic allocation. This is not a criticism of honggfuzz, but more of an important note of how development often occurs. Early prototyping, success, and rare revisiting of what can be changed. What’s my point here? Well, the mutation strategies in many fuzzers may introduce timing properties that are not fundamentally required to have identical behaviors. There’s nothing wrong with this, but it is additional noise which factors into time-based benchmarks. This means a good strategy can be hurt by a bad implementation, or, just a naive one that was done early on. This is noise that I think is big to remove from analysis such that we can try to learn what ideas work, and engineer them later.
Further, I don’t know of any mutational fuzzer which doesn’t mutate in-place. This means the multiple splices and removals from an input must end up memcpy()ing the remainder. This is a very common mutation pass. This means the fuzzer exponentially slows down WRT the input file size. Something we see almost every fuzzer put insane restrictions on (AFL has a fit if you give it anything but a tiny file).
There’s nothing stopping us from making a tree-based fuzzer where a splice adds a node to the tree and updates metadata on other nodes. The input could be serialized once when it’s ready to be consumed, or even better, serialized on-demand, only providing the parts of the file which actually were used during the fuzz case.
Example:

Initial input: "foobar", tree is [pointer to "foobar", length 6]
Splice "baz" at 3: [pointer to "foo", length 3][pointer to "baz", length 3][pointer to "bar", length 3]
Program read()s 3 bytes, return "foo" without serializing the rest
Program crashes, tree can be saved or even just what has read can be saved
In this, the cost is N updates to some basic metadata, where N is the number of mutations performed on that input (often 5-10). On a new fuzz case, you start with an initial input in one node of the tree, and you can once again split it up as needed. Pretty much no memcpys() need to be performed, nor allocations, as the input can be extended such that in-memory it’s “foobarbaz”, but the metadata describes that the “baz” should come between “foo”, and “bar”.
Restructuring the way we do mutations like this allows us to probably easily find 10x improvements in mutator performance (read, not overall fuzzer performance). Meaning, I don’t really want the cost of the mutator to be part of the equation, because once again, it’s likely a result of laziness or simplicity. If something really brings a strategy to the table that is excellent, we can likely make it work just as fast (but likely even faster), than existing strategies.
Not to note the value in potentially knowing which mutations were used during prior cases, and you could potentially mutate this tree (eg, change a splice from 5 bytes to 8 bytes, without changing the offset, just changing the node in the mutation tree). This could also be used as a mechanism to dynamically weight mutation strategies based on yields, while still getting a performance gain over the naive implementation.
Performance conclusion
From previous work with fuzzers, most of the reset, overhead, and corruption logic is likely not even within an order of magnitude of the possible performance. Thus, I’m far more interested in figuring out what and where strategies work, as the implementations of them are typically not indicative of their performance.
BUT! I recognize the value in treating them as whole systems. I’m a bit more on the hard-core engineering side of the problem. I’m interested in which strategies work, not which tools. There’s definitely value in knowing which tools will work best, given you don’t have the time to tweak or rebuild them yourself. That being said, I think scaling is much more important here, as I don’t know of really anyone doing single-core fuzzing. The results of these fuzzers at scale is likely dramatically different from single-core, and would put some major pressure on some more theoretical ideas which produce way too much information to consume and handle.
Reconstructing the full picture from data
The data I would like to see fuzzbench give, and I’d give you some massive props for doing it, would be the raw, microsecond-timestamped information for each coverage gained.
This means, every time coverage increases, a new CSV record (or whatever format) is generated, including the time stamp when it was found (to the microsecond), as well as the fuzz iteration ID which indicates how many inputs have been run into the fuzzer. This should also include a unique identifier of the block which was found.
This means, in post, the entire progress of the fuzzer can be reconstructed. Every edge, which edges they were, the times they were found, and the case ID they were on when they were found allows comparing not only the raw “edge count” but also the differences between edges found. It’s crazy that this information is not part of the benchmark, as almost all the fuzzers could be finding nearly the same coverage, but a fuzzer which finds less coverage, but completely unique edges, would be devalued.
This is the firehose of data, but since it’s not collected on an interval, it very quickly turns into almost no data.
Hard problem: What is coverage?
This leads to a really hard problem. How do we compare coverage between tools? Can we safely create a unique block identifier which is universal between all the fuzzers and their targets. I have no idea how fuzzbench solves this (or even if it does). If fuzzbench is relying on the fuzzers to have roughly the same idea of what an edge is, I’d say the results are completely invalid. Having different passes which add different coverage gathering, compare information gathering, could easily affect the graphs. Even just non-determinism in clang (or whatever compiler) would make me uneasy about if afl-clang binaries have identical graph shapes to libfuzzer-clang binaries.
If fuzzbench does solve this problem, I’m curious as to how. I’d anticipate it would be through a coverage pass which is standardized between all targets. If this is the case, are they using the same binaries? If they’re not, are the binaries deterministic, or can the fuzzers affect the benchmark coverage information due to adding their own compiler instrumentation.
Further, if this is the case, it makes it much harder to compare emulators or other tools which gather their own coverage in a unique way. For example, if my emulators, which get coverage for effectively free, had to run an instrumented binary for fuzzbench to get data, it’s not a realistic comparison. My fuzzer would be penalized twice for coverage gathering, even though it doesn’t need the instrumented binary.
Maybe someone solved this problem, and I’m curious what the solution is. TL;DR: Are we actually comparing the same binaries with identical graphs, and is this fair to fuzzers which do not need compile-time instrumentation.
The end
Can’t wait for more discussion. You have been very receptive even when I’m often a bit strongly opinion-ed. I respect that a lot.
Stay cute,
gamozo