CPU Introspection: Intel Load Port Snooping
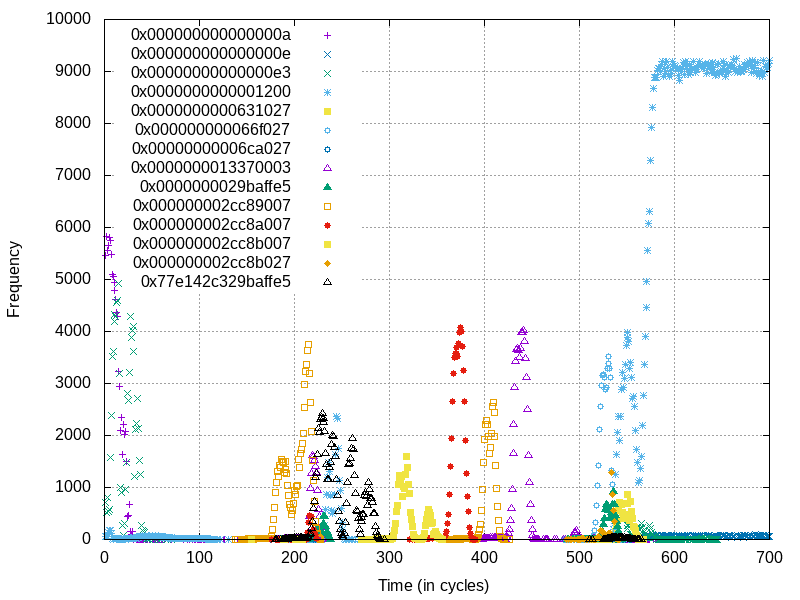
Frequencies of observed values over time from load ports. Here we’re seeing the processor internally performing a microcode-assisted page table walk to update accessed and dirty bits. Only one load was performed by the user, these are all “invisible” loads done behind the scenes
Follow me at @gamozolabs on Twitter if you want notifications when new blogs come up. I often will post data and graphs from data as it comes in and I learn!
Foreward
First of all, I’d like to say that I’m super excited to write up this blog. This is an idea I’ve had for over a year and I only recently got to working on. The initial implementation and proof-of-concept of this idea was actually implemented live on my Twitch! This proof-of-concept went from nothing at all to a fully-working-as-predicted implementation in just about 3 hours! Not only did the implementation go much smoother than expected, the results are by far higher resolution and signal-to-noise than I expected!
This blog is fairly technical, and thus I highly recommend that you read my previous blog on Sushi Roll, my CPU research kernel where this technique was implemented. In the Sushi Roll blog I go a little bit more into the high-level details of Intel micro-architecture and it’s a great introduction to the topic if you’re not familiar.
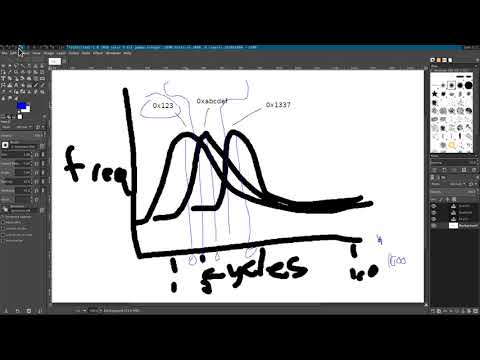
Recording of the stream where we implemented this idea as a proof-of-concept. Click for the YouTube video!
Summary
We’re going to go into a unique technique for observing and sequencing all load port traffic on Intel processors. By using a CPU vulnerability from the MDS set of vulnerabilities, specifically multi-architectural load port data sampling (MLPDS, CVE-2018-12127), we are able to observe values which fly by on the load ports. Since (to my knowledge) all loads must end up going through load ports, regardless of requestor, origin, or caching, this means in theory, all contents of loads ever performed can be observed. By using a creative scanning technique we’re able to not only view “random” loads as they go by, but sequence loads to determine the ordering and timing of them.
We’ll go through some examples demonstrating that this technique can be used to view all loads as they are performed on a cycle-by-cycle basis. We’ll look into an interesting case of the micro-architecture updating accessed and dirty bits using a microcode assist. These are invisible loads dispatched on the CPU on behalf of the user when a page is accessed for the first time.
Why
As you may be familiar, x86 is quite a complex architecture with many nooks and crannies. As time has passed it has only gotten more complex, leading to fewer known behaviors of the inner workings. There are many instructions with complex microcode invocations which access memory as were seen through my work on Sushi Roll. This led to me being curious as to what is actually going on with load ports during some of these operations.
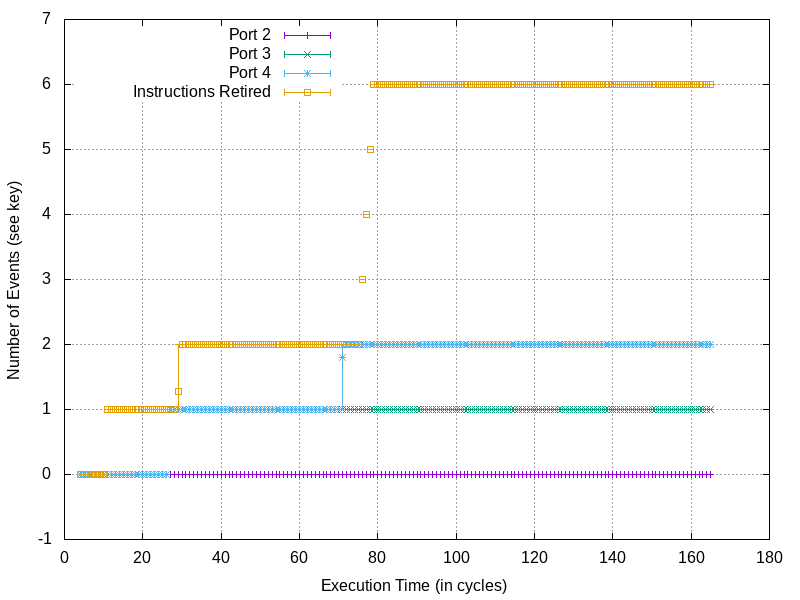
Intel CPU traffic on load ports (ports 2 and 3) and store ports (port 4) during a traditional memory write
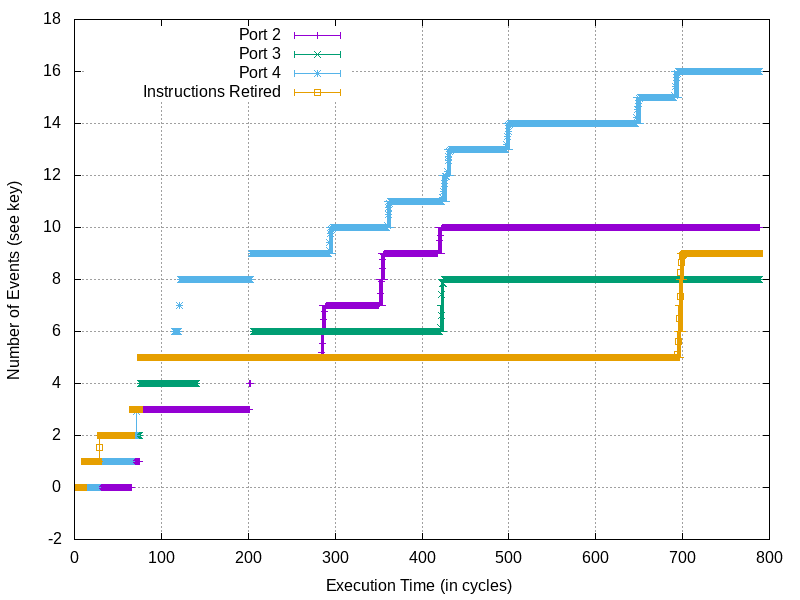
Intel CPU traffic on load ports (ports 2 and 3) and store ports (port 4) during the same memory write as above, but this time where the page table entries need an accessed/dirty bit update
Beyond just directly invoked microcode due to instructions being executed, microcode also gets executed on the processor during “microcode assists”. These operations, while often undocumented, are referenced a few times throughout Intel manuals. Specifically in the Intel Optimization Manual there are references to microcode assists during accessed and dirty bit updates. Further, there is a restriction on TSX sections such that they may abort when accessed and dirty bits need to be updated. These microcode assists are fascinating to me, as while I have no evidence for it, I suspect they may be subject to different levels of permissions and validations compared to traditional operations. Whenever I see code executing on a processor as a side-effect to user operations, all I think is: “here be dragons”.
A playground for CPU bugs
When I start auditing a target, the first thing that I try to do is get introspection into what is going on. If the target is an obscure device then I’ll likely try to find some bug that allows me to image the entire device, and load it up in an emulator. If it’s some source code I have that is partial, then I’ll try to get some sort of mocking of the external calls it’s making and implement them as I come by them. Once I have the target running on my terms, and not the terms of some locked down device or environment, then I’ll start trying to learn as much about it as possible…
This is no different from what I did when I got into CPU research. Starting with when Meltdown and Spectre came out I started to be the go-to person for writing PoCs for CPU bugs. I developed a few custom OSes early on that were just designed to give a pass/fail indicator if a CPU bug were able to be exploited in a given environment. This was critical in helping test the mitigations that went in place for each CPU bug as they were reported, as testing if these mitigations worked is a surprisingly hard problem.
This led to me having some cleanly made OS-level CPU exploits written up. The custom OS proved to be a great way to test the mitigations, especially as the signal was much higher compared to a traditional OS. In fact, the signal was almost just a bit too strong…
When in a custom operating system it’s a lot easier to play around with weird behaviors of the CPU, without worrying about it affecting the system’s stability. I can easily turn off interrupts, overwrite exception handlers with specialized ones, change MSRs to weird CPU states, and so on. This led to me ending up with almost a playground for CPU vulnerability testing with some pretty standard primitives.
As the number of primitives I had grew, I was able to PoC out a new CPU bug in typically under a day. But then I had to wonder… what would happen if I tried to get the most information out of the processor as possible.
Sushi Roll
And that was the starting of Sushi Roll, my CPU research kernel. I have a whole blog about the Sushi Roll research kernel, and I strongly recommend you read it! Effectively Sushi Roll is a custom kernel with message passing between cores rather than memory sharing. This means that each core has a complete copy of the kernel with no shared accesses. For attacks which need to observe the faintest signal in memory behaviors, this lead to a great amount of isolation.
When looking for a behavior you already understand on a processor, it’s pretty easy to get a signal. But, when doing initial CPU research into the unknowns and undefined behavior, getting this signal out takes every advantage as you can get. Thus in this low-noise CPU research environment, even the faintest leak would cause a pretty large disruption in determinism, which would likely show up as a measurable result earlier than traditional blind CPU research would allow.
Performance Counter Monitoring
In Sushi Roll I implemented a creative technique for monitoring the values in performance counters along with time-stamping them in cycles. Some of the performance counters in Intel processors count things like the number of micro-ops dispatched to each of the execution units on the core. Some of these counters increase during speculation, and with this data and time-stamping I was able to get some of the first-ever insights into what processor behavior was actually occurring during speculation!
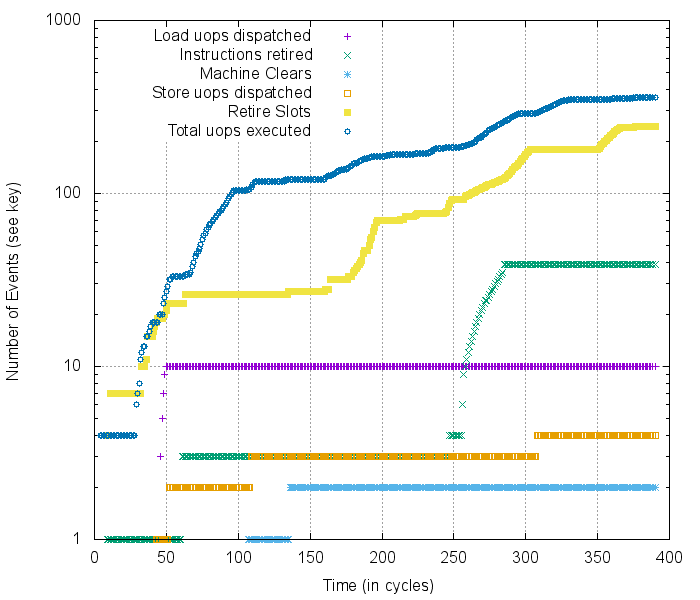 Example cycle-by-cycle profiling of the Kaby Lake micro-architecture,
warning: log-scale y-axis
Example cycle-by-cycle profiling of the Kaby Lake micro-architecture,
warning: log-scale y-axis
Being able to collect this sort of data immediately made unexpected CPU behaviors easier to catalog, measure, and eventually make determinstic. The more understanding we can get of the internals of the CPU, the better!
The Ultimate Goal
The ultimate goal of my CPU research is to understand so thoroughly how the Intel micro-architecture works that I can predict it with emulation models. This means that I would like to run code through an emulated environment and it would tell me exactly how many internal CPU resources would be used, which lines from caches and buffers would be evicted and what contents they would hold. There’s something beautiful to me to understanding something so well that you can predict how it will behave. And so the journey begins…
Past Progress
So far with the work in Sushi Roll we’ve been able to observe how the CPU dispatches uops during specific portions of code. This allows us to see which CPU resources are used to fulfill certain requests, and thus can provide us with a rough outline of what is happening. With simple CPU operations this is often all we need, as there are only so many ways to perform a certain operation, the complete picture can usually be drawn just from guessing “how they might have done it”. However, when more complex operations are involved, all of that goes out the window.
When reading through Intel manuals I saw many references to microcode assists. These are “situations” in your processor which may require microcode to be dispatched to execution units to perform some complex-ish logic. These are typically edge cases which don’t occur frequently enough for the processor to worry about handling them in hardware, rather just needing to detect them and cause some assist code to run. We know of one microcode assist which is relatively easy to trigger, updating the accessed and dirty bits in the page tables.
Accessed and dirty bits
In the Intel page table (and honestly most other architectures) there’s a concept of accessed and dirty bits. These bits indicate whether or not a page has ever been translated (accessed), or if it has been written to (dirtied). On Intel it’s a little strange as there is only a dirty bit on the final page table entry. However, the accessed bits are present on each level of the page table during the walk. I’m quite familiar with these bits from my work with hypervisor-based fuzzing as it allows high performance differential resetting of VMs by simply walking the page tables and restoring pages that were dirtied to their original state of a snapshot.
But this leads to an curiosity… what is the mechanic responsible for setting these bits? Does the internal page table silicon set these during a page table walk? Are they set after the fact? Are they atomically set? Are they set during speculation or faulting loads?
From Intel manuals and some restrictions with TSX it’s pretty obvious that accessed and dirty bits are a bit of an anomaly. TSX regions will abort when memory is touched that does not have the respective accessed or dirty bits set. Which is strange, why would this be a limitation of the processor?
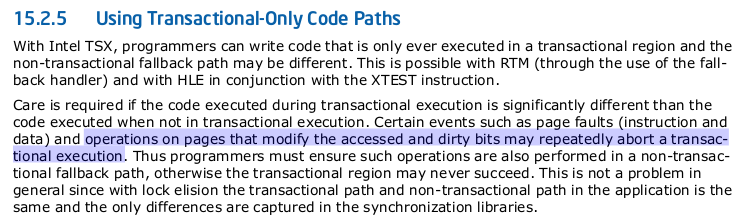
Accessed and dirty bits causing TSX aborts from the Intel® 64 and IA-32 architectures optimization reference manual
… weird huh? Testing it out yields exactly what the manual says. If I write up some sample code which accesses memory which doesn’t have the respective accessed or dirty bits set, it aborts every time!
What’s next?
So now we have an ability to view what operation types are being performed on the processor. However this doesn’t tell us a huge amount of information. What we would really benefit from would be knowing the data contents that are being operated on. We can pretty easily log the data we are fetching in our own code, but that won’t give us access to the internal loads that happen as side effects on the processor, nor would it tell us about the contents of loads which happen during speculation.
Surely there’s no way to view all loads which happen on the processor right? Almost anything during speculation is a pain to observe, and even if we could observe the data it’d be quite noisy.
Or maybe there is a way…
… a way?
Fortunately there may indeed be a way! A while back I found a CPU vulnerability which allowed for random values to be sampled off of the load ports. While this vulnerability is initially thought to only allow for random values to be sampled from the load ports, perhaps we can get a bit more creative about leaking…
Multi-Architectural Load Port Data Sampling (MLPDS)
Multi-architectural load port data sampling sounds like an overly complex name, but it’s actually quite simple in the end. It’s a set of CPU flaws in Intel processors which allow a user to potentially get access to stale data recently transferred through load ports. This was actually a bug that I reported to Intel a while back and they ended up finding a few similar issues with different instruction combinations, this is ultimately what comprises MLPDS.

Description of MLPDS from Intel’s MDS DeepDive
The specific bug that I found was initially called “cache line split” or “cache line split load” and it’s exactly what you might expect. When a data access straddles a cache line (multi-byte load containing some bytes on one cache line and the remaining bytes on another). Cache lines are 64-bytes in size so any multi-byte memory access to an address with the bottom 6 bits set would cause this behavior. These accesses must also cause a fault or an assist, but by using TSX it’s pretty easy to get whatever behavior you would like.
This bug is largely an issue when hyper-threading is enabled as this allows a sibling thread to be executing protected/privileged code while another thread uses this attack to observe recently loaded data.
I found this bug when working on early PoCs of L1TF when we were assessing the impact it had. In my L1TF PoC (which was using random virtual addresses each attempt) I ended up disabling the page table modification. This ultimately is the root requirement for L1TF to work, and to my surprise, I was still seeing a signal. I initially thought it was some sort of CPU bug leaking registers as the value I was leaking was never actually read in my code. It turns out what I ended up observing was the hypervisor itself context switching my VM. What I was leaking was the contents of the registers as they were loaded during the context switch!
Unfortunately MLPDS has a really complex PoC…
mov rax, [-1]
After this instruction executes and it faults or aborts, the contents of
rax during a small speculative window will potentially contain stale data
from load ports. That’s all it takes!
From this point it’s just some trickery to get the 64-bit value leaked during the speculative window!
It’s all too random
Okay, so MLPDS allows us to sample a “random” value which was recently loaded on the load ports. This is a great start as we could probably run this attack over and over and see what data is observed on a sample piece of code. Using hyper-threading for this attack will be ideal because we can have one thread running some sample code in an infinite loop, while the other code observes the values seen on the load port.
An MLPDS exploit
Since there isn’t yet a public exploit for MLPDS, especially with the data rates we’re going to use here, I’m just going to go over the high-level details and not show how it’s implemented under the hood.
For this MLPDS exploit I use a couple different primitives. One is a pretty basic exploit which simply attempts to leak the raw contents of the value which was leaked. This value that we leak is always 64-bits, but we can chose to only leak a few of the bytes from it (or even bit-level granularity). There’s a performance increase for the fewer bytes that we leak as it decreases the number of cache lines we need to prime-and-probe each attempt.
There’s also another exploit type that I use that allows me to look for a specific value in memory, which turns the leak from a multi-byte leak to just a boolean “was value/wasn’t value”. This is the highest performance version due to how little information has to be leaked past the speculative window.
All of these leaks will leak a specific value from a single speculative run. For example if we were to leak a 64-bit value, the 64-bit value will be from one MLPDS exploit and one speculative window. Getting an entire 64-bit value out during a single speculative window is a surprisingly hard problem, and I’m going to keep that as my own special sauce for a while. Compared to many public CPU leak exploits, this attack does not loop multiple times using masks to slowly reveal a value, it will get revealed from a single attempt. This is critical to us as otherwise we wouldn’t be able to observe values which are loaded once.
Here’s some of the leak rate numbers for the current version of MLPDS that I’m using:
| Leak type | Leaks/second |
|---|---|
| Known 64-bit value | 5,979,278 |
| 8-bit any value | 228,479 |
| 16-bit any value | 116,023 |
| 24-bit any value | 25,175 |
| 32-bit any value | 13,726 |
| 40-bit any value | 12,713 |
| 48-bit any value | 10,297 |
| 56-bit any value | 9,521 |
| 64-bit any value | 8,234 |
It’s important to note that the known 64-bit value search is much faster than all of the others. We’ll make some good use of this later!
Test
Let’s try out a simple MLPDS attack on a small piece of code which loops forever fetching 2 values from memory.
mov  rax, 0x12345678f00dfeed
mov [0x1000], rax

mov  rax, 0x1337133713371337
mov [0x1008], rax

2:
    mov rax, [0x1000]
    mov rax, [0x1008]
    jmp 2b
This code should in theory just causes two loads. One of a value
0x12345678f00dfeed and another of a value 0x1337133713371337. Lets spin
this up on a hardware thread and have the sibling thread perform MLPDS in a
loop! We’ll use our 64-bit any value MLPDS attack and just histogram all of the
different values we observe get leaked.
Sampling done:
    0x12345678f00dfeed : 100532
    0x1337133713371337 : 99217
Viola! Here we see the two different secret values on the attacking thread, at a pretty much comparable frequency.
Cool… so now we have a technique that will allow us to see the contents of all loads on load ports, but randomly sampled only. Let’s take a look at the weird behaviors during accessed bit updates by clearing the accessed bit on the final level page tables every loop in the same code above.
Sampling done:
    0x0000000000000008 : 559
    0x0000000000000009 : 2316
    0x000000000000000a : 142
    0x000000000000000e : 251
    0x0000000000000010 : 825
    0x0000000000000100 : 19
    0x0000000000000200 : 3
    0x0000000000010006 : 438
    0x000000002cc8c000 : 3796
    0x000000002cc8c027 : 225
    0x000000002cc8d000 : 112
    0x000000002cc8d027 : 57
    0x000000002cc8e000 : 1
    0x000000002cc8e027 : 35
    0x00000000ffff8bc2 : 302
    0x00002da0ea6a5b78 : 1456
    0x00002da0ea6a5ba0 : 2034
    0x0000700dfeed0000 : 246
    0x0000700dfeed0008 : 5081
    0x0000930000000000 : 4097
    0x00209b0000000000 : 15101
    0x1337133713371337 : 2028
    0xfc91ee000008b7a6 : 677
    0xffff8bc2fc91b7c4 : 2658
    0xffff8bc2fc9209ed : 4565
    0xffff8bc2fc934019 : 2
Whoa! That’s a lot more values than we saw before. They weren’t from just the two
values we’re loading in a loop, to many other values. Strangely the 0x1234...
value is missing as well. Interesting. Well since we know these are accessed
bit updates, perhaps some of these are entries from the page table walk. Let’s
look at the addresses of the page table entry we’re hitting.
CR3   0x630000
PML4E 0x2cc8e007
PDPE  0x2cc8d007
PDE   0x2cc8c007
PTE   0x13370003
Oh! How cool is that!? In the loads we’re leaking we see the raw page table entries with various versions of the accessed and dirty bits set! Here are the loads which stand out to me:
Leaked values:

    0x000000002cc8c000 : 3796
    0x000000002cc8c027 : 225
    0x000000002cc8d000 : 112
    0x000000002cc8d027 : 57
    0x000000002cc8e000 : 1
    0x000000002cc8e027 : 35

Actual page table entries for the page we're accessing:

CR3   0x630000
PML4E 0x2cc8e007
PDPE  0x2cc8d007
PDE   0x2cc8c007
PTE   0x13370003
The entries are being observed as 0x...27 as the 0x20 bit is the accessed
bit for page table entries.
Other notable entries are 0x0000930000000000 and 0x00209b0000000000 which
look like the GDT entries for the code and data segments. 0x0000700dfeed0000
and 0x0000700dfeed0008 which are the 2 virtual addresses I’m accessing the
un-accessed memory from. Who knows about the rest of the values? Probably some
stack addresses in there…
So clearly as we expected, the processor is dispatching uops which are performing a page table walk. Sadly we have no idea what the order of this walk is, maybe we can find a creative technique for sequencing these loads…
Sequencing the Loads
Sequencing the loads that we are leaking with MLPDS is going to be critical to getting meaningful information. Without knowing the ordering of the loads we simply know contents of loads. Which is a pretty awesome amount of information, I’m definitely not complaining… but come on, it’s not perfect!
But perhaps we can limit the timing of our attack to a specific window, and infer ordering based on that. If we can find some trigger point where we can synchronize time between the attacker thread and the thread with secrets, we could change the delay between this synchronization and the leak attempt. By scanning this leak we should hopefully get to see a cycle-by-cycle view of observed values.
A trigger point
We can perform an MLPDS attack on a delay, however we need a reference point to delay from. I’ll steal the oscilloscope terminology of a trigger, or a reference location to synchronize with. Similar to an oscilloscope this trigger will synchronize our on the time domain each time we attempt.
The easiest trigger we can use works only in an environment where we control both the leaking and secret threads, but in our case we have that control.
What we can do is simply have semaphores at each stage of the leak. We’ll have 2 hardware threads running with the following logic:
- (Thread A running) (Thread B paused)
- (Thread A) Prepare to do a CPU attack, request thread B execute code
- (Thread A) Delay for a fixed amount of cycles with a spin loop
- (Thread B) Execute sample code
- (Thread A) At some “random” point during Thread B executing sample code, perform MLPDS attack to leak a value
- (Thread B) Complete sample code execution, wait for thread A to request another execution
- (Thread A) Log the observed value and the number of cycles in the delay loop
- goto 0 and do this many times until significant data is collected
Uncontrolled target code
If needed a trigger could be set on a “known value” at some point during execution if target code is not controllable. For example, if you’re attacking a kernel, you could identify a magic value or known user pointer which gets accessed close to the code under test. An MLPDS attack can be performed until this magic value is seen, then a delay can start, and another attack can be used to leak a value. This allows an uncontrolled target code to be sampled in a similar way. If the trigger “misses” it’s fine, just try again in another loop.
Did it work?
So we put all of these things together, but does it actually work? Lets try our 2 load example, and we’ll make sure they depend on each other to ensure they don’t get re-ordered by the processor.
Prep code:
core::ptr::write_volatile(vaddr as *mut u64, 0x12341337cafefeed);
core::ptr::write_volatile((vaddr as *mut u64).offset(1), 0x1337133713371337);
Test code:
let ptr = core::ptr::read_volatile(vaddr as *mut usize);
core::ptr::read_volatile((vaddr as usize + (ptr & 0x8)) as *mut usize);
In this code we set up 2 dependant loads. One which reads a value, and then
another which masks the value to get the 8th bit, which is used as an offset to
a subsequent access. Since the values are constants, we know that the second
access will always access at offset 8, thus we expect to see a load of
0x1234... followed by 0x1337....
Graphing the data
To graph the data we have collected, we want to collect the frequencies each value was seen for every cycle offset. We’ll plot these with an x axis in cycles, and a y axis in frequency the value was observed at that cycle count. Then we’ll overlay multiple graphs for the different values we’ve seen. Let’s check it out in our simple case test code!
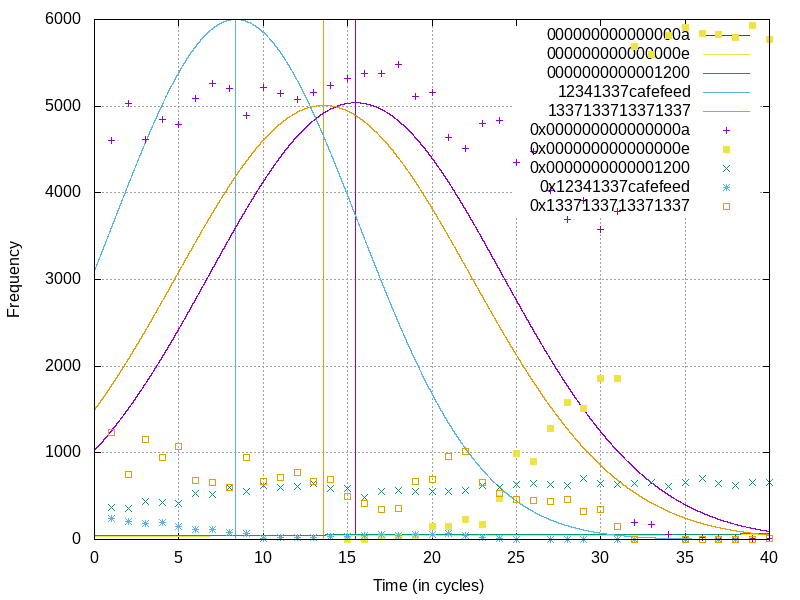 Sequenced leak example data
Here we also introduce a normal distribution best-fit for each value type, and a vertical line through the mean frequency-weighted value.
And look at that! We see the first access (in light blue) indicating that the
value 0x12341337cafefeed was read, and slightly after we see (in orange) the
value 0x1337133713371337 was read! Exactly what we would have expected. How
cool is that!? There’s some other noise on here from the testing harness, but
they’re pretty easy to ignore in this case.
A real-data case
Let’s put it all together and take a look at what a load looks like on pages which have not yet been marked as accessed.
Frequencies of observed values over time from load ports. Here we’re seeing the processor internally performing a microcode-assisted page table walk to update accessed and dirty bits. Only one load was performed by the user, these are all “invisible” loads done behind the scenes
Hmmm, this is a bit too noisy. Let’s re-collect the data but this time only look at the page table entry values and the value contained on the page we’re accessing.
Here are the page table entries for the memory we’re accessing in our example:
CR3   0x630000
PML4E 0x2cc7c007
PDPE  0x2cc7b007
PDE   0x2cc7a007
PTE   0x13370003
Data  0x12341337cafefeed
We’re going to reset all page table entries to their non-dirty, non-accessed
states, invalidate the TLB for the page via invlpg, and then read from the
memory once. This will cause all accessed bits to be updated in the page
tables! Here’s what we get…
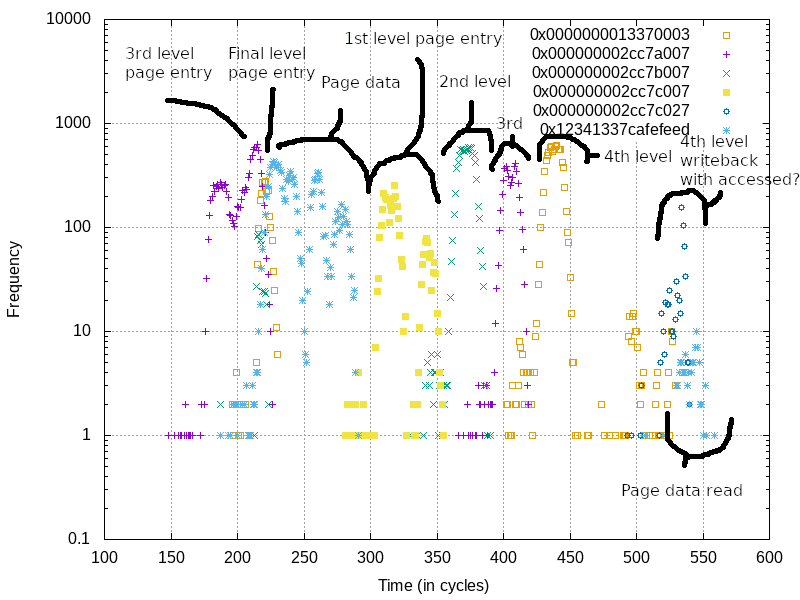 Annotated ucode-assist page walk as observed with this technique
Here it’s hard to say why we see the 3rd and 4th levels of the page table get
hit, as well as the page contents, prior to the accessed bit updates. Perhaps
the processor tries the access first, and when it realizes the accessed bits
are not set it goes through and sets them all. We can see fairly clearly that
after this page data is read ~300 cycles in, that it performs a page-by-page
walk through each level. Presumably this is where the processor is reading the
original values from pages, oring in the accessed bit, and moving to the next
level!
Speeding it up
So far using our 64-bit MLPDS leak we can get about 8,000 leaks per second. This is a decent data rate, but when we’re wanting to sample data and draw statistical significance, more is always better. For each different value we want to log, and for each cycle count, we likely want about ~100 points of data. So lets assume we want to sample 10 values over a 1000 cycle range, and we’ll likely want 1 million data points. This means we’ll need about 2 minutes worth of runtime to collect this data.
Luckily, there’s a relatively simple technique we can use to speed up the data rates. Instead of using the full arbitrary 64-bit leak for the whole test, we can use the arbitrary leak early on to determine the values of interest. We just want to use the arbitrary leak for long enough to determine the values which we know are accessed during our test case.
Once we know the values we actually want to leak, we can switch to using our known-value leak which allows for about 6 million leaks per second. Since this can only look for one value at a time, we’ll also have to cycle through the values in our “known value” list, but the speedup is still worth it until the known value list gets incredibly large.
With this technique, collecting the 1 million data points for something with 5-6 values to sample only takes about a second. A speedup of two orders of magnitude! This is the technique that I’m currently using, although I have a fallback to arbitrary value mode if needed for some future use.
Conclusion
We introduced an interesting technique for monitoring Intel load port traffic cycle-by-cycle and demonstrated that it can be used to get meaningful data to learn how Intel micro-architecture works. While there is much more for us to poke around in, this was a simple example to show this technique!
Future
There is so much more I want to do with this work. First of all, this will just be polished in my toolbox and used for future CPU research. It’ll just be a good go-to tool for when I need a little bit more introspection. But, I’m sure as time goes on I’ll come up with new interesting things to monitor. Getting logging of store-port activity would be useful such that we could see the other side of memory transactions.
As with anything I do, performance is always an opportunity for improvement. Getting a higher-fidelity MLPDS exploit, potentially with higher throughput, would always help make collecting data easier. I’ve also got some fun ideas for filtering this data to remove “deterministic noise”. Since we’re attacking from a sibling hyperthread I suspect we’d see some deterministic sliding and interleaving of core usage. If I could isolate these down and remove the noise that’d help a lot.
I hope you enjoyed this blog! See you next time!